Estimating Transfer Size of Blocked Requests with Gradient-Boosted Trees
Firefox blocks trackers for more than 200 million people, but a blocked request is never sent, so its cost is never observed. I built an on-device model that estimates each blocked request’s transfer size from what is known before sending.
Three choices shaped it. Labels come from a public crawl with blocking off, and paired fetches confirmed they transfer to Firefox. A Tweedie loss fits the target, which is mostly zeros with a long tail. About 80 features, mostly from the URL, are computed locally, since nothing may leave the device.
- 37.6% lower per-request error than the shippable lookup table, and better than a 188 MB full-URL table, using 500 KB of trees with a median prediction time of 50 µs.
- 6% error on a weekly total, vs 22% for the table. The table is biased low, and that bias adds up over a week.
- The loss mattered most. Squared error was 31% worse than Tweedie.
- Quarterly retraining, based on measured drift. The model leads at every horizon out to six months.
Problem Formulation
Firefox’s Enhanced Tracking Protection checks each outgoing request against a list of known trackers and drops matches before they leave the machine. A count of blocked requests weighs an empty beacon the same as a 170 KB script bundle, and counts and bytes diverge: advertising accounts for two thirds of tracker requests but under a fifth of the bytes, whereas tag managers account for 6% of requests and 41% of the bytes.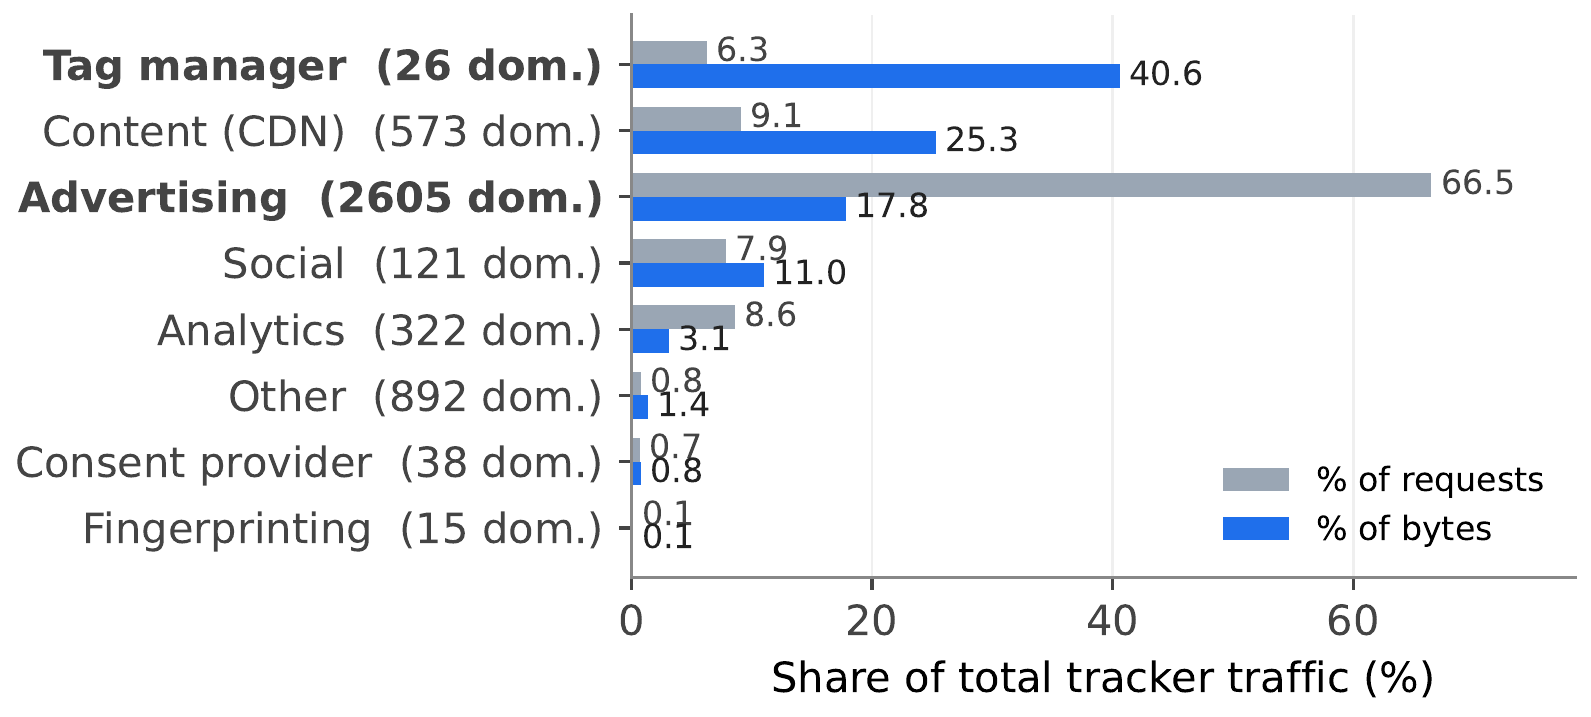 Advertising makes 66.5% of tracker requests but carries 17.8% of the bytes, while tag managers make 6.3% and carry 40.6%.
The quantity of interest is the data that blocking saved, which the browser never observes. The target is therefore a counterfactual: the size of the response a dropped request would have received had it been allowed. The product goal is to report what blocking saved, not only how much it blocked.
Formally, let denote everything the browser knows about a request before sending it and the bytes its response would have transferred. The model estimates , and the user is shown the weekly sum .
Constraints
No prior work addresses this per request: Brave reports page-level estimates and Safari and others report counts, so no published per-request accuracy exists for comparison. Five constraints define the problem, and each determined part of the design.
| Constraint | What it decided |
|---|---|
| The response is never observed | Labels come from another environment |
| Only pre-send signals exist | The URL is the feature space |
| On-device: about 500 KB, tens of µs, low-end phones | Gradient-boosted trees, not a neural network |
| Nothing leaves the device | Every feature is computed locally |
| Users see a weekly sum | An objective that estimates the mean; evaluation on totals |
The project comprised the research, the infrastructure in Firefox’s engine that records blocking events and runs inference, and the new-tab widget that displays the estimate. This article concerns primarily the first.
Data
Label Transfer
The user’s machine cannot supply labels, but a tracker URL fetched with blocking disabled returns a real response. HTTP Archive crawls millions of pages a month with trackers allowed and records every response, a public substitute for telemetry Firefox would never collect that keeps the work reproducible.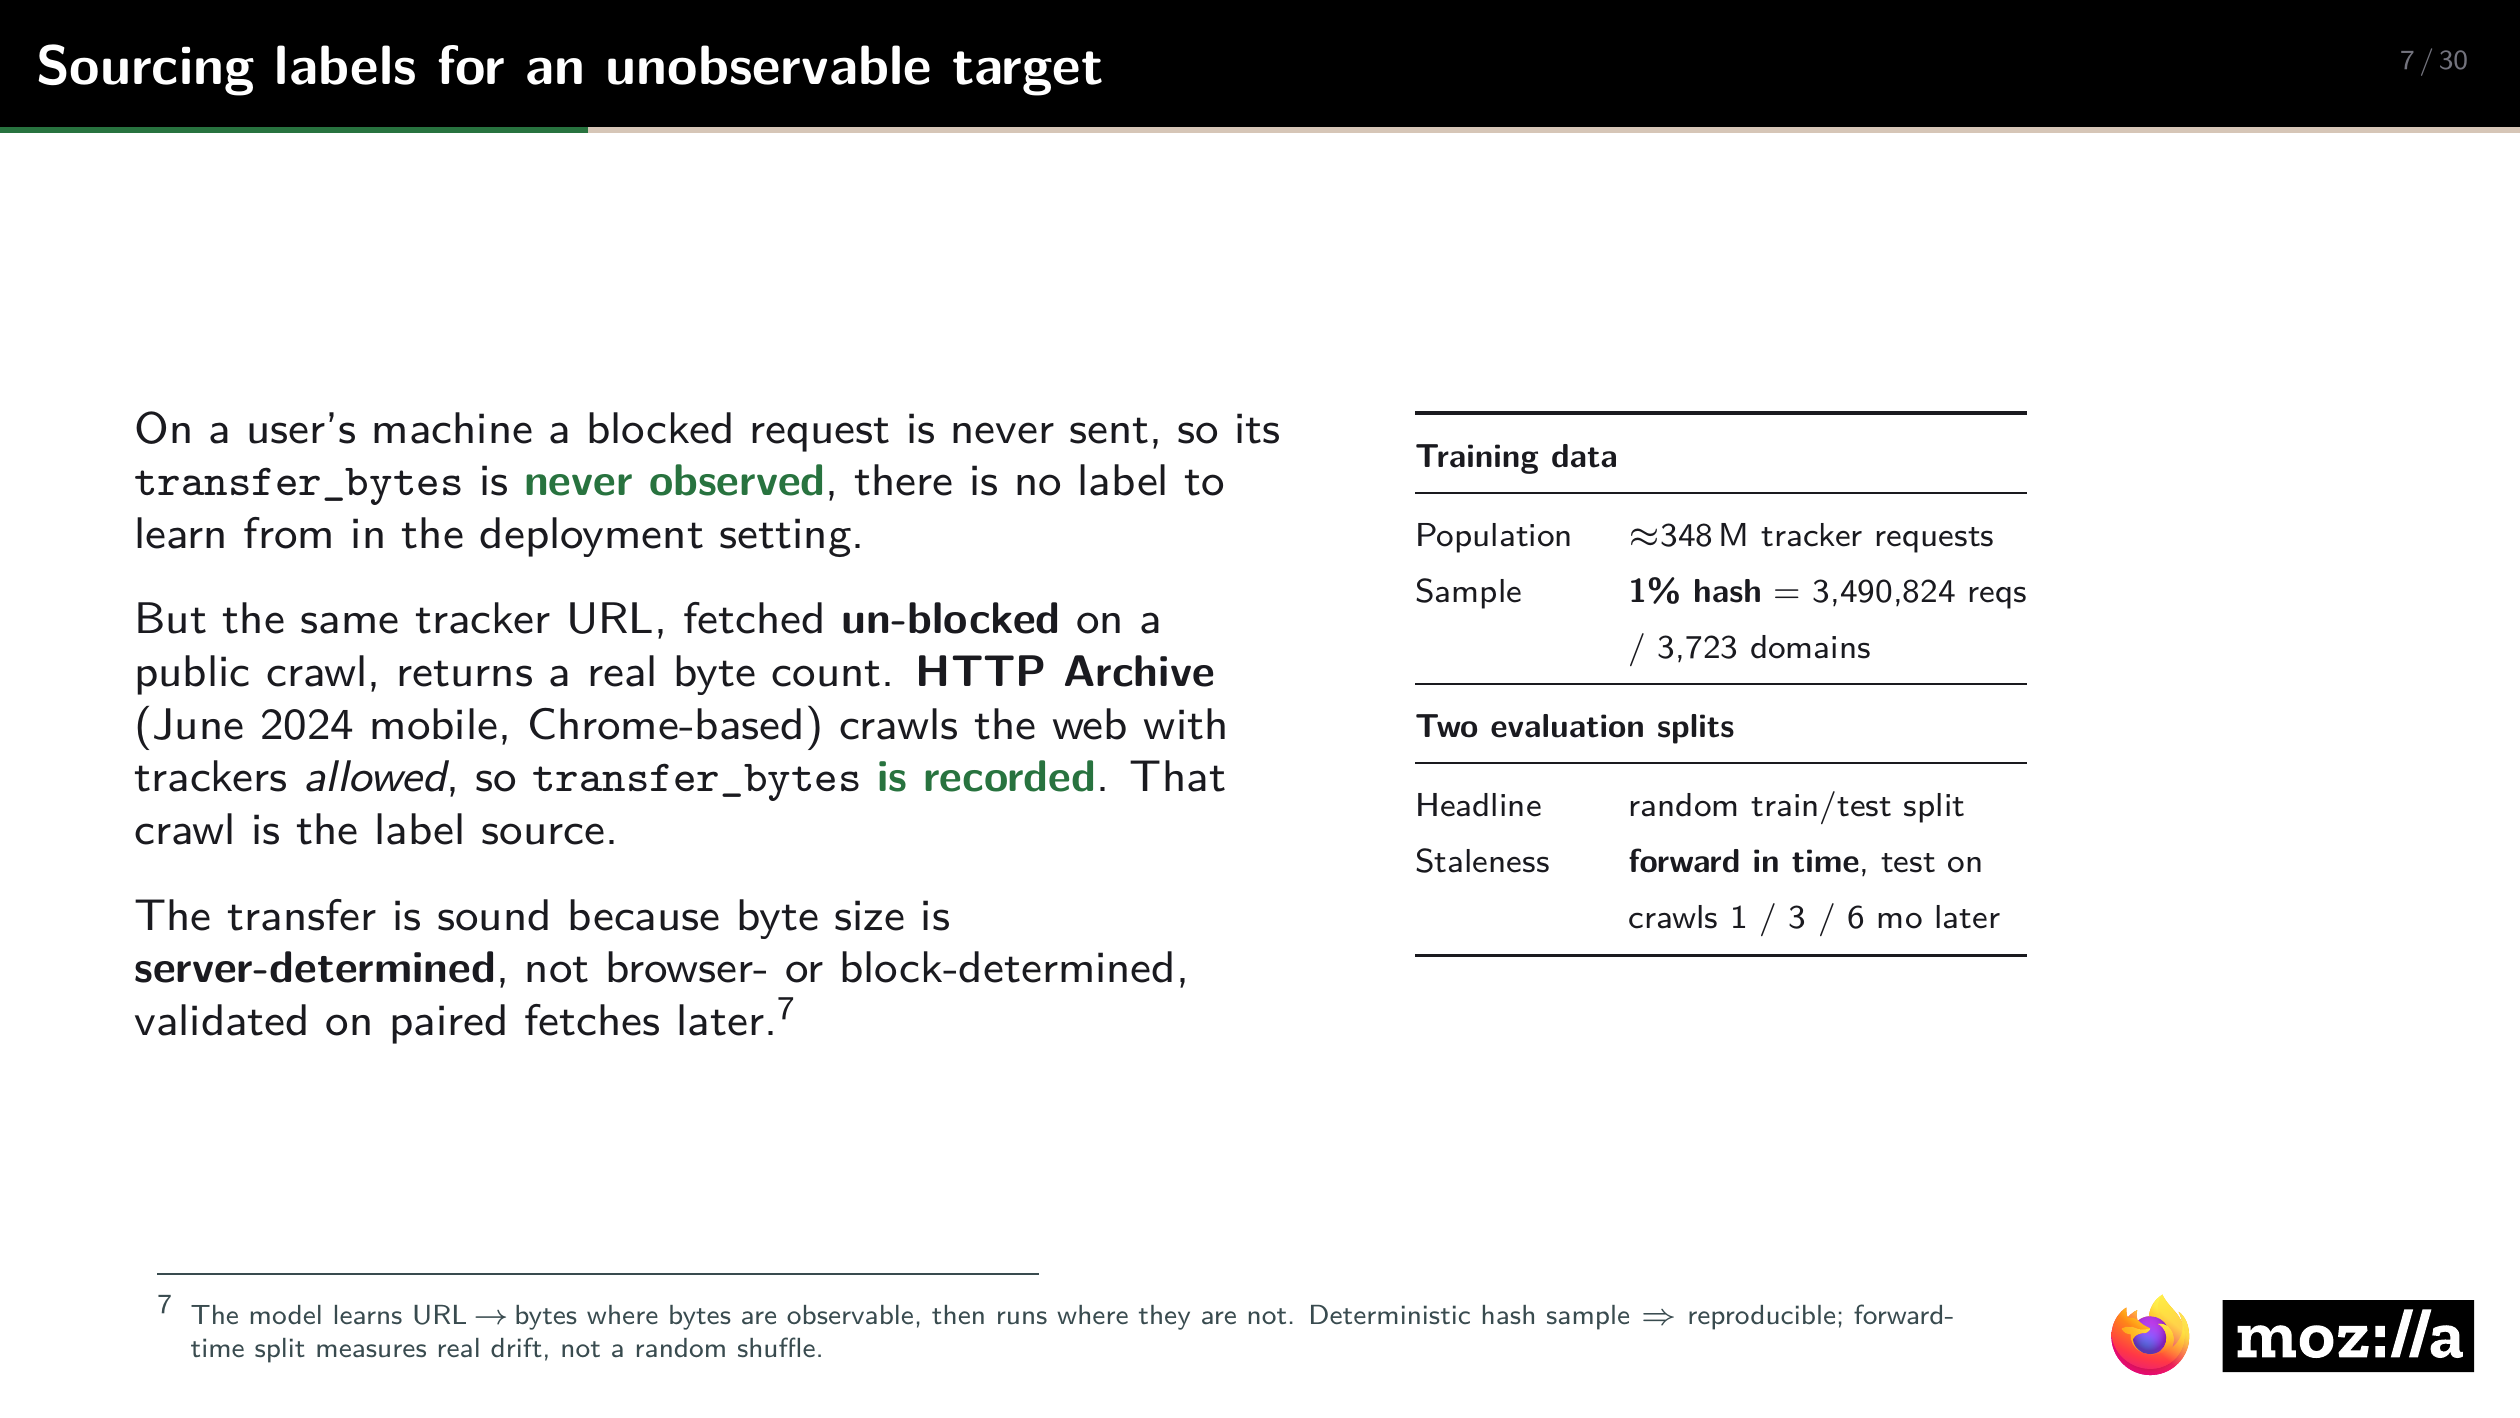 Presentation slide: label source, sample, and evaluation splits.
This is valid only if the learned relationship holds in both environments. The mix of requests differs between the crawl and Firefox browsing, but the size a given request receives does not, because the server sets it: the inputs shift while stays fixed, which is covariate shift. Because the crawl uses Chrome, 46 tracker URLs were fetched from both Firefox and Chrome. The median byte ratio was 1.000, and 97.8% agreed within 5%; the one outlier, reCAPTCHA at 0.63, serves browser-specific payloads.
From roughly 348 million tracker requests in the June 2024 mobile crawl, a deterministic hash of page and URL reproducibly selects 3.5 million across 3,723 domains. A random 70/15/15 split yields the headline numbers. A forward-in-time split, training on June and testing one, three, and six months later, measures how the model ages, since a random split leaks the future into the past.
Target Distribution
Two properties of the data drive the design. First, 39.4% of tracker requests return exactly zero bytes, since many tracking requests serve only to be received; the rest form a heavy tail extending to 14 MB.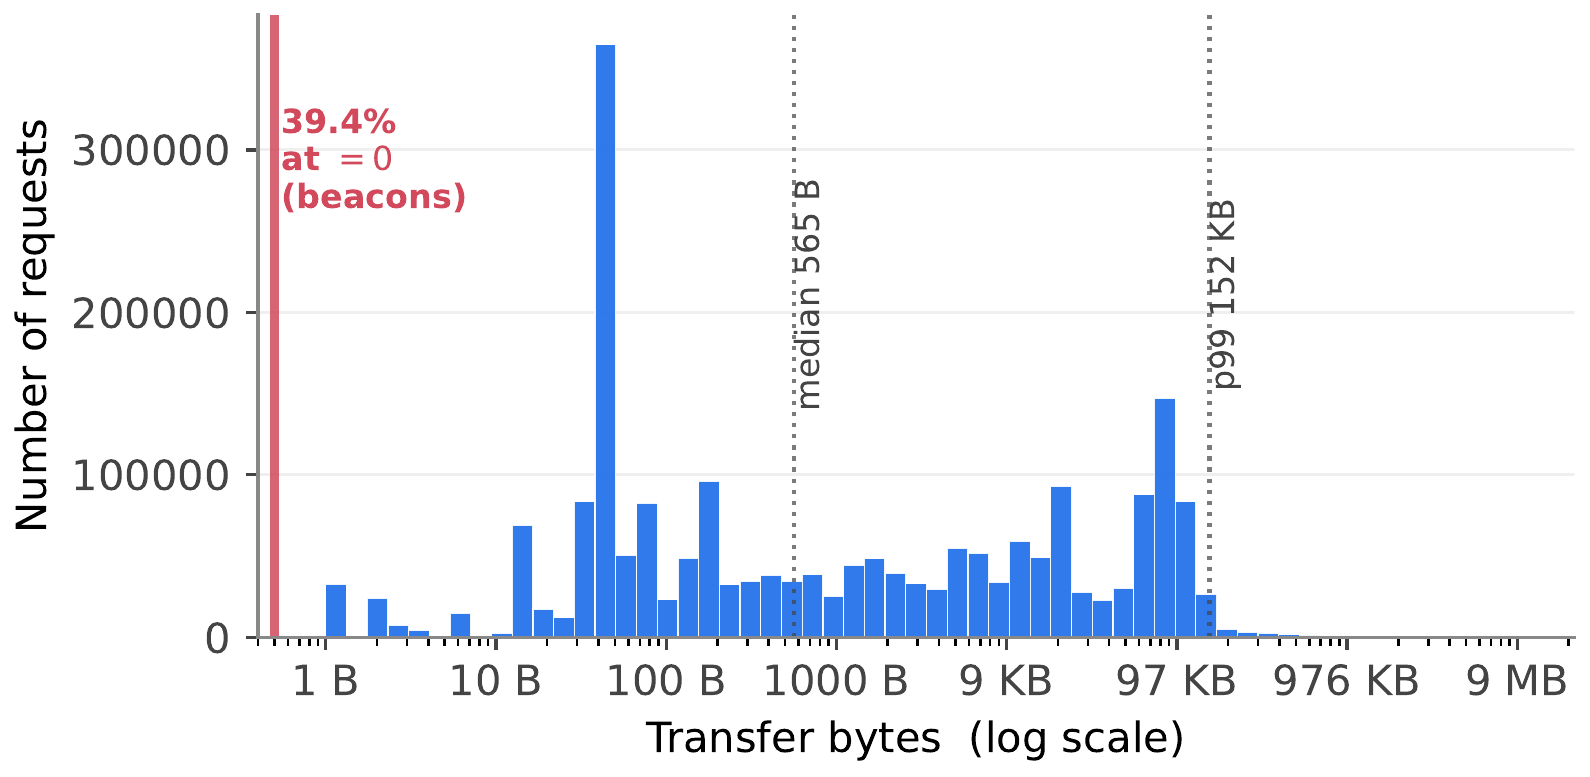 Transfer size per tracker request: a spike of exact zeros, then a heavy tail.
Second, cost is a property of the URL rather than the domain. Sizes within one domain can span three orders of magnitude: the coefficient of variation (standard deviation relative to the mean) is 0.94 at the median domain and 3.0 at the 90th percentile, and one domain may serve a 93 KB script from one path and an empty beacon from another. The space of paths is also open-ended: three quarters of distinct test paths never appear in training, even within the same month. A few popular paths carry most traffic, so about 92% of test requests still match a seen path; memorization fails on the rest.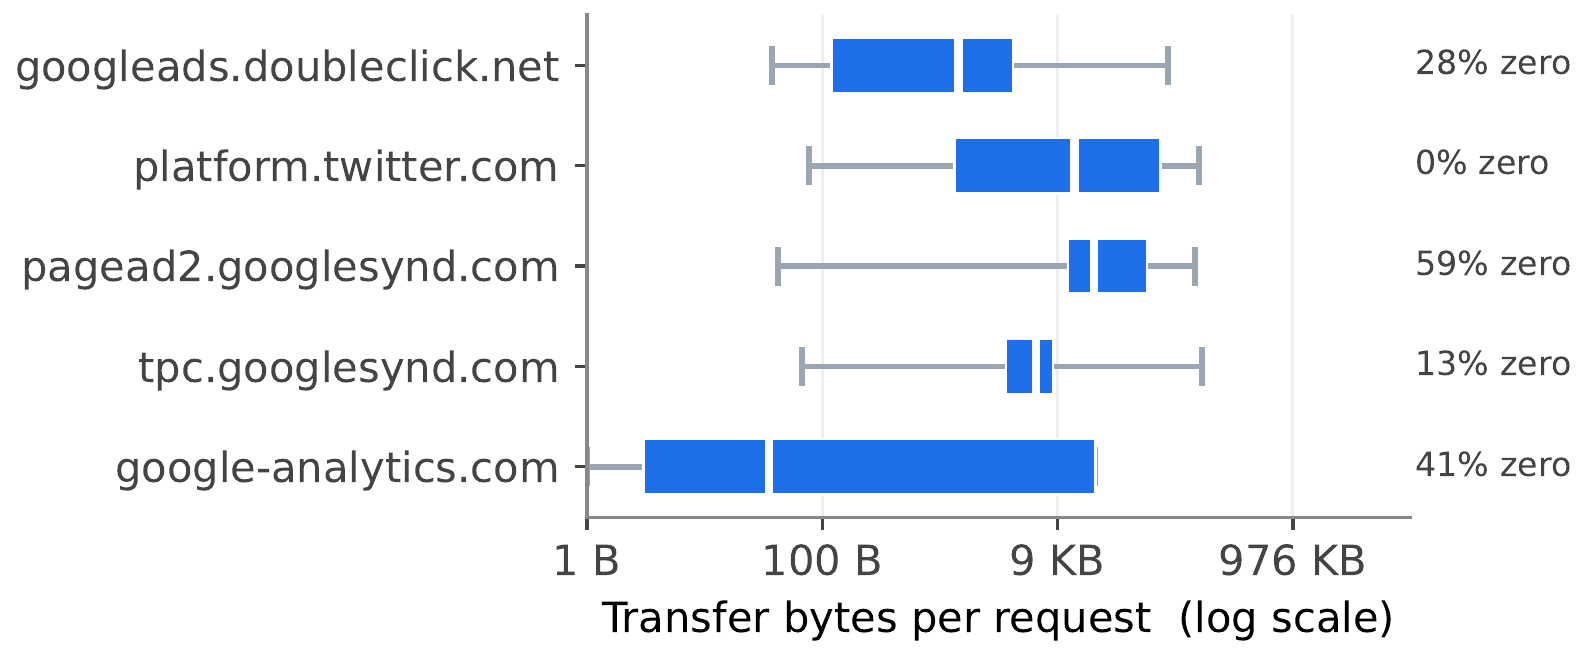 Five tracker domains whose sizes span orders of magnitude, so that no single value per domain fits.
Baselines
The baseline is what Firefox could ship instead: a 114 KB lookup table keyed on tracker domain and resource type, storing each key’s median size. Finer keys help, but the key that resolves URL-level variation, the full path, requires about 16 million rows and 188 MB and cannot handle unseen paths. The model must therefore learn what URL structure implies about size rather than memorize URLs.
Error is reported as mean absolute error (MAE), the average number of bytes by which a prediction misses, because squared error on a target spanning five orders of magnitude is dominated by a few multi-megabyte responses. MAE is minimized by the median, not the mean, which becomes important later.
Model
Loss Function
Squared error assumes every response is equally noisy. Here the spread of sizes grows with their magnitude, so a few multi-megabyte residuals dominate the gradient and the zeros are fit poorly; a linear model (ridge regression) performs worse than the table it would replace.
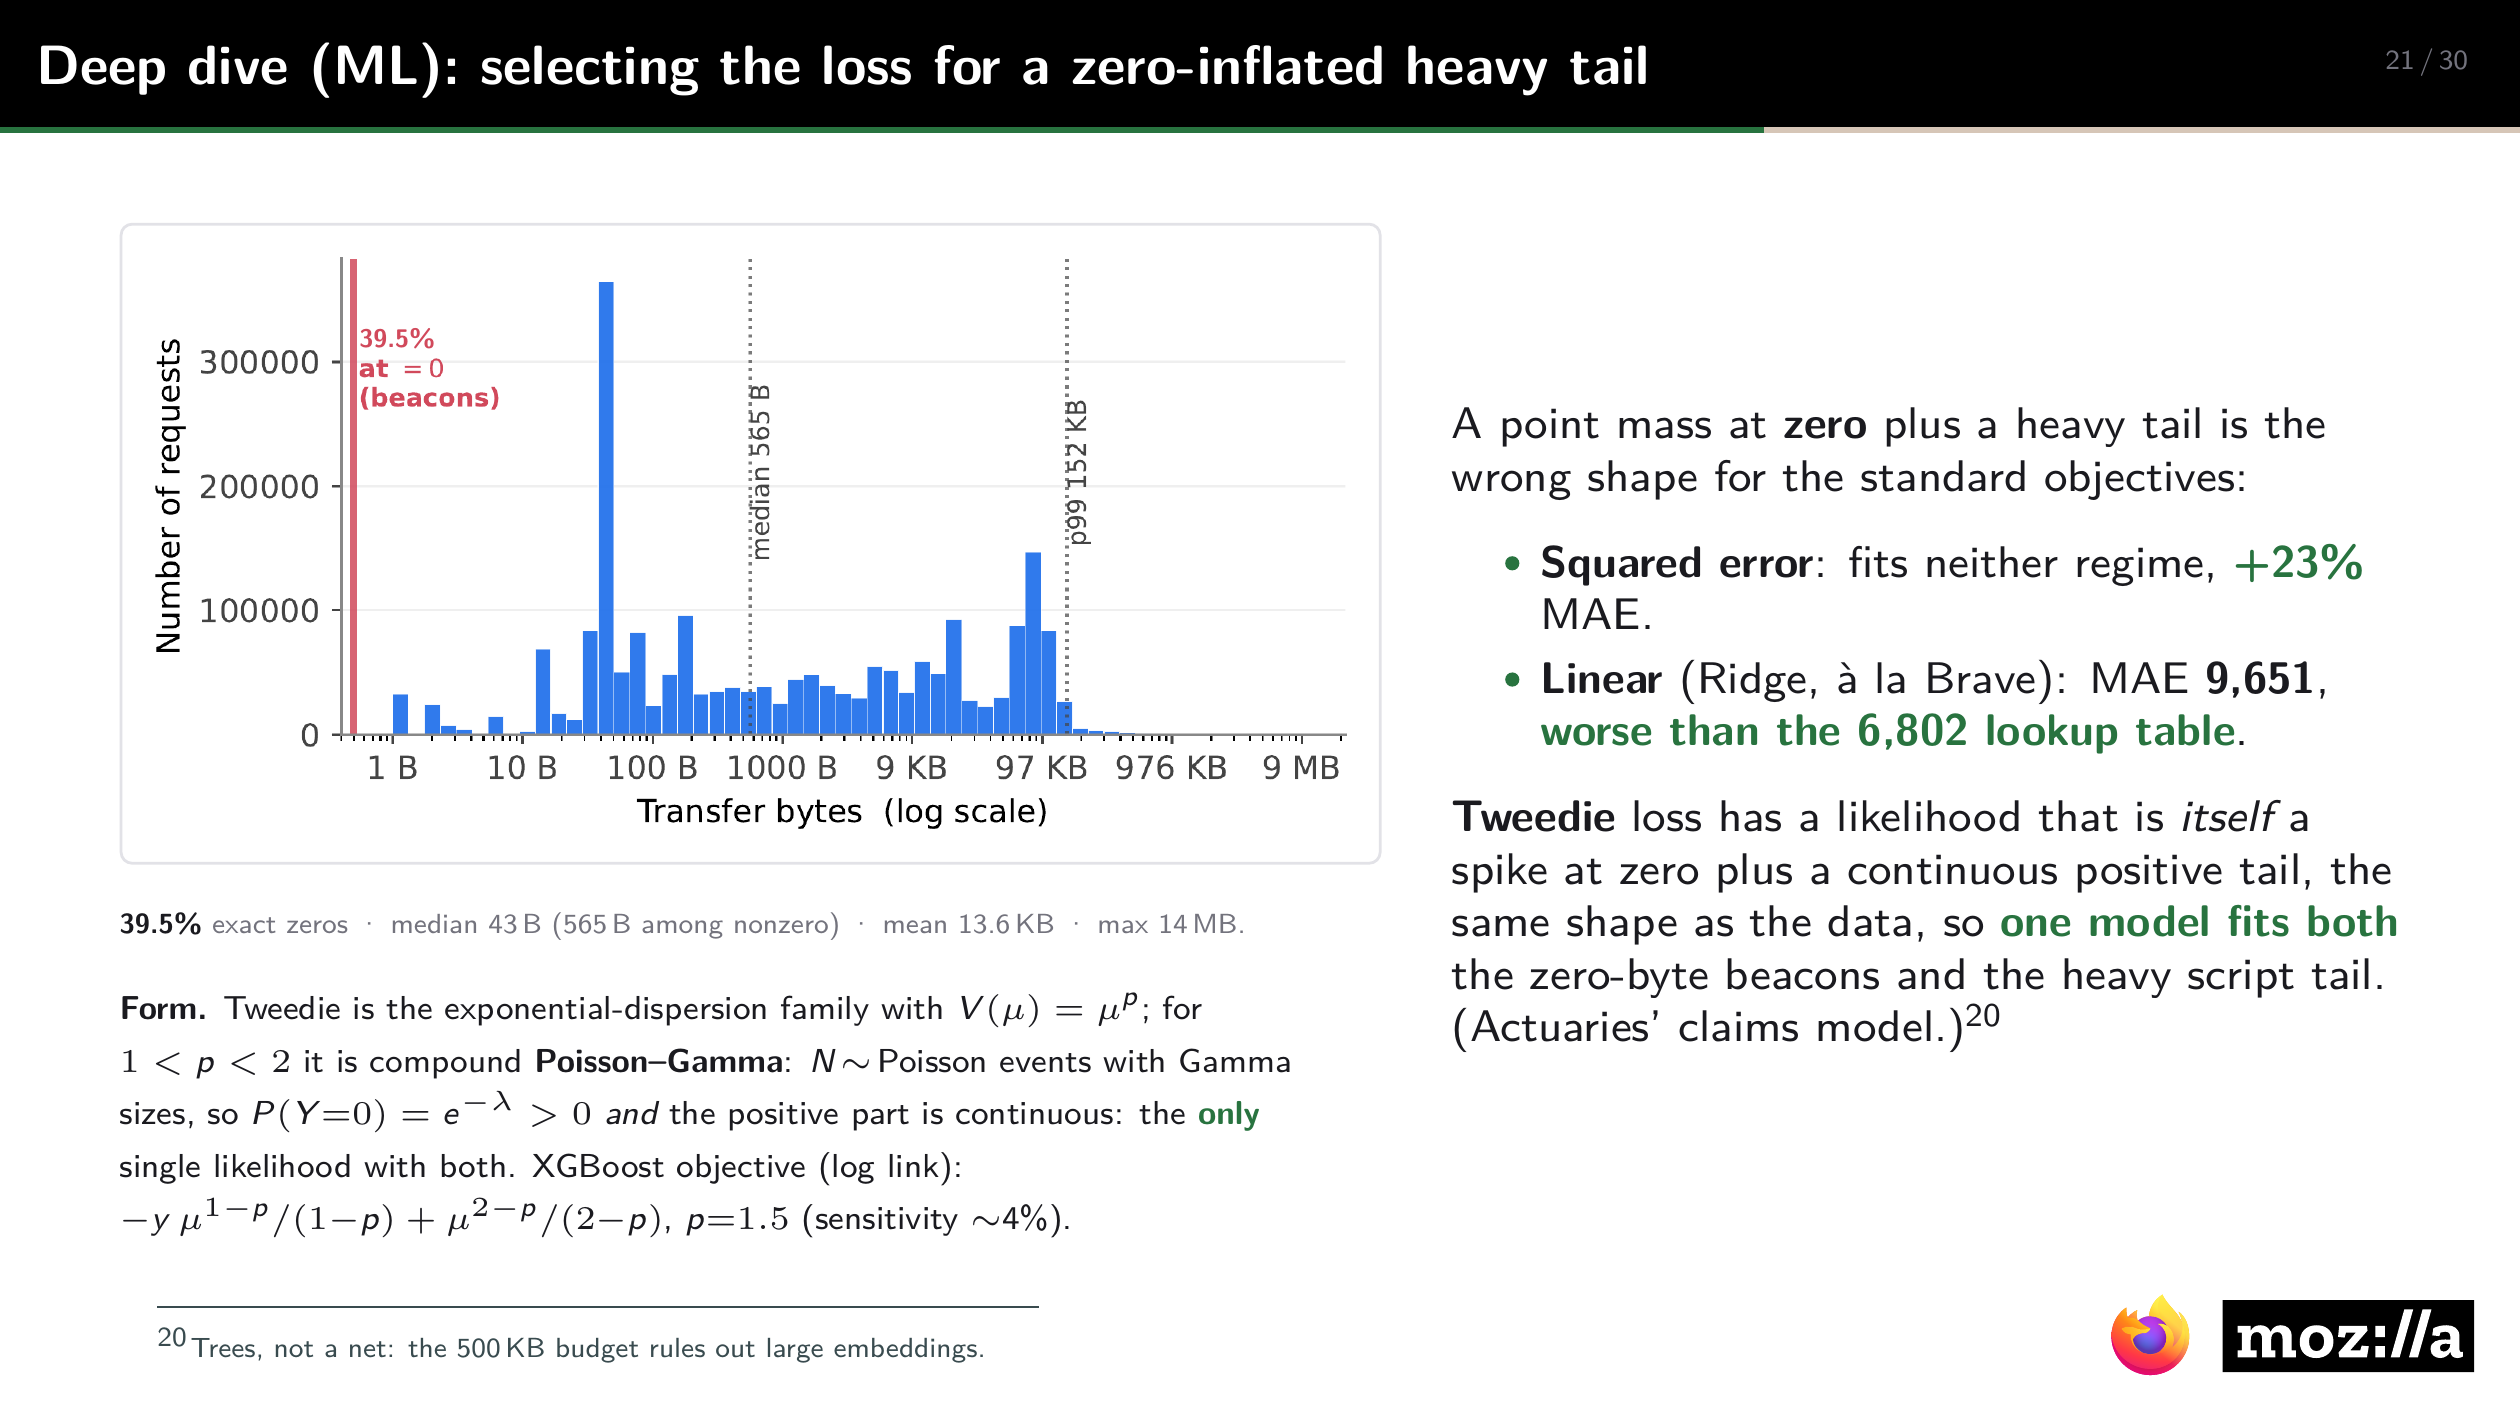
The data require a positive probability of exactly zero, a continuous positive tail, and variance that grows with the mean. The Tweedie family satisfies all three. For a variance power ,
and is compound Poisson–Gamma: a Poisson number of events, each with a Gamma-distributed size. Zero events yield exactly zero, with probability , so one likelihood covers both regimes without the separate zero classifier of a hurdle model. The model predicts , where is the sum of the trees’ outputs, so the log link keeps predictions positive, and it minimizes
The gradient with respect to is , so residuals on large predictions, where noise is high, are scaled down, while the expected loss is still minimized at the conditional mean. Changing only the objective to squared error raises MAE by 31% and lowers rank correlation with the true sizes from 0.95 to 0.74. Varying across changes error by about 4%, so the loss family matters more than its parameter.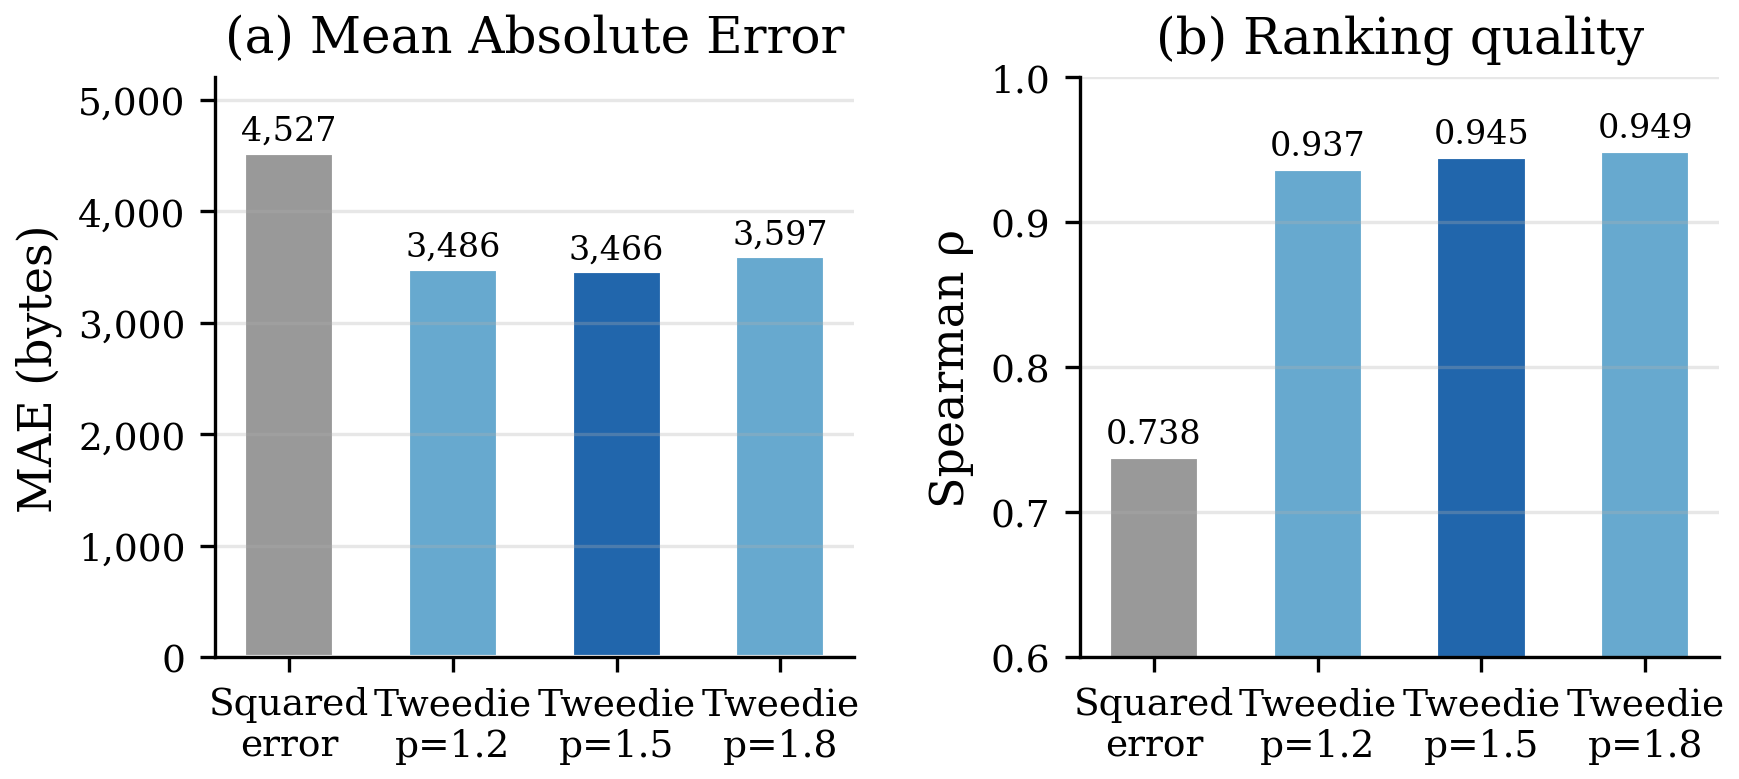 Only the objective changes between bars, in an ablation run separate from the headline evaluation.
Model Selection
The model is an XGBoost ensemble of 500 trees of depth 8, with learning rate 0.05 and early stopping on a validation fold. Four properties of the problem favor boosted trees: Presentation slide: XGBoost with Tweedie loss against a character-level CNN on raw URLs.
- Tabular features, for which boosted trees remain the strongest general method.
- A strict size budget. The trees export to about 500 KB.
- Inexpensive inference. One root-to-leaf path per tree, at most 4,000 comparisons: a median of 50 µs and a 99th-percentile latency of 93 µs on one CPU thread.
- Reviewability. Importances and ablations can be audited, which a privacy feature requires.
A character-level convolutional network over raw URLs, with 72,705 parameters, ranked requests well but had 25% higher absolute error, 5,320 bytes against 4,246. The comparison is not controlled, as the network used a smaller sample and a log-space loss, but its disadvantages are structural: about four examples per parameter, token structure to rediscover from characters, and a size budget that precludes a larger network. Unstructured inputs, far more data, or no size budget would change the choice; none applied here.
Feature Representation
With only pre-send signals, the URL is effectively the feature space. Each feature must be predictive, computable on the device before sending, and unable to leak information; features requiring server data or user information are excluded. This constraint makes the three-way selection tractable, since the feasible space is small enough to cover systematically, with importances and single-factor ablations guiding the search.
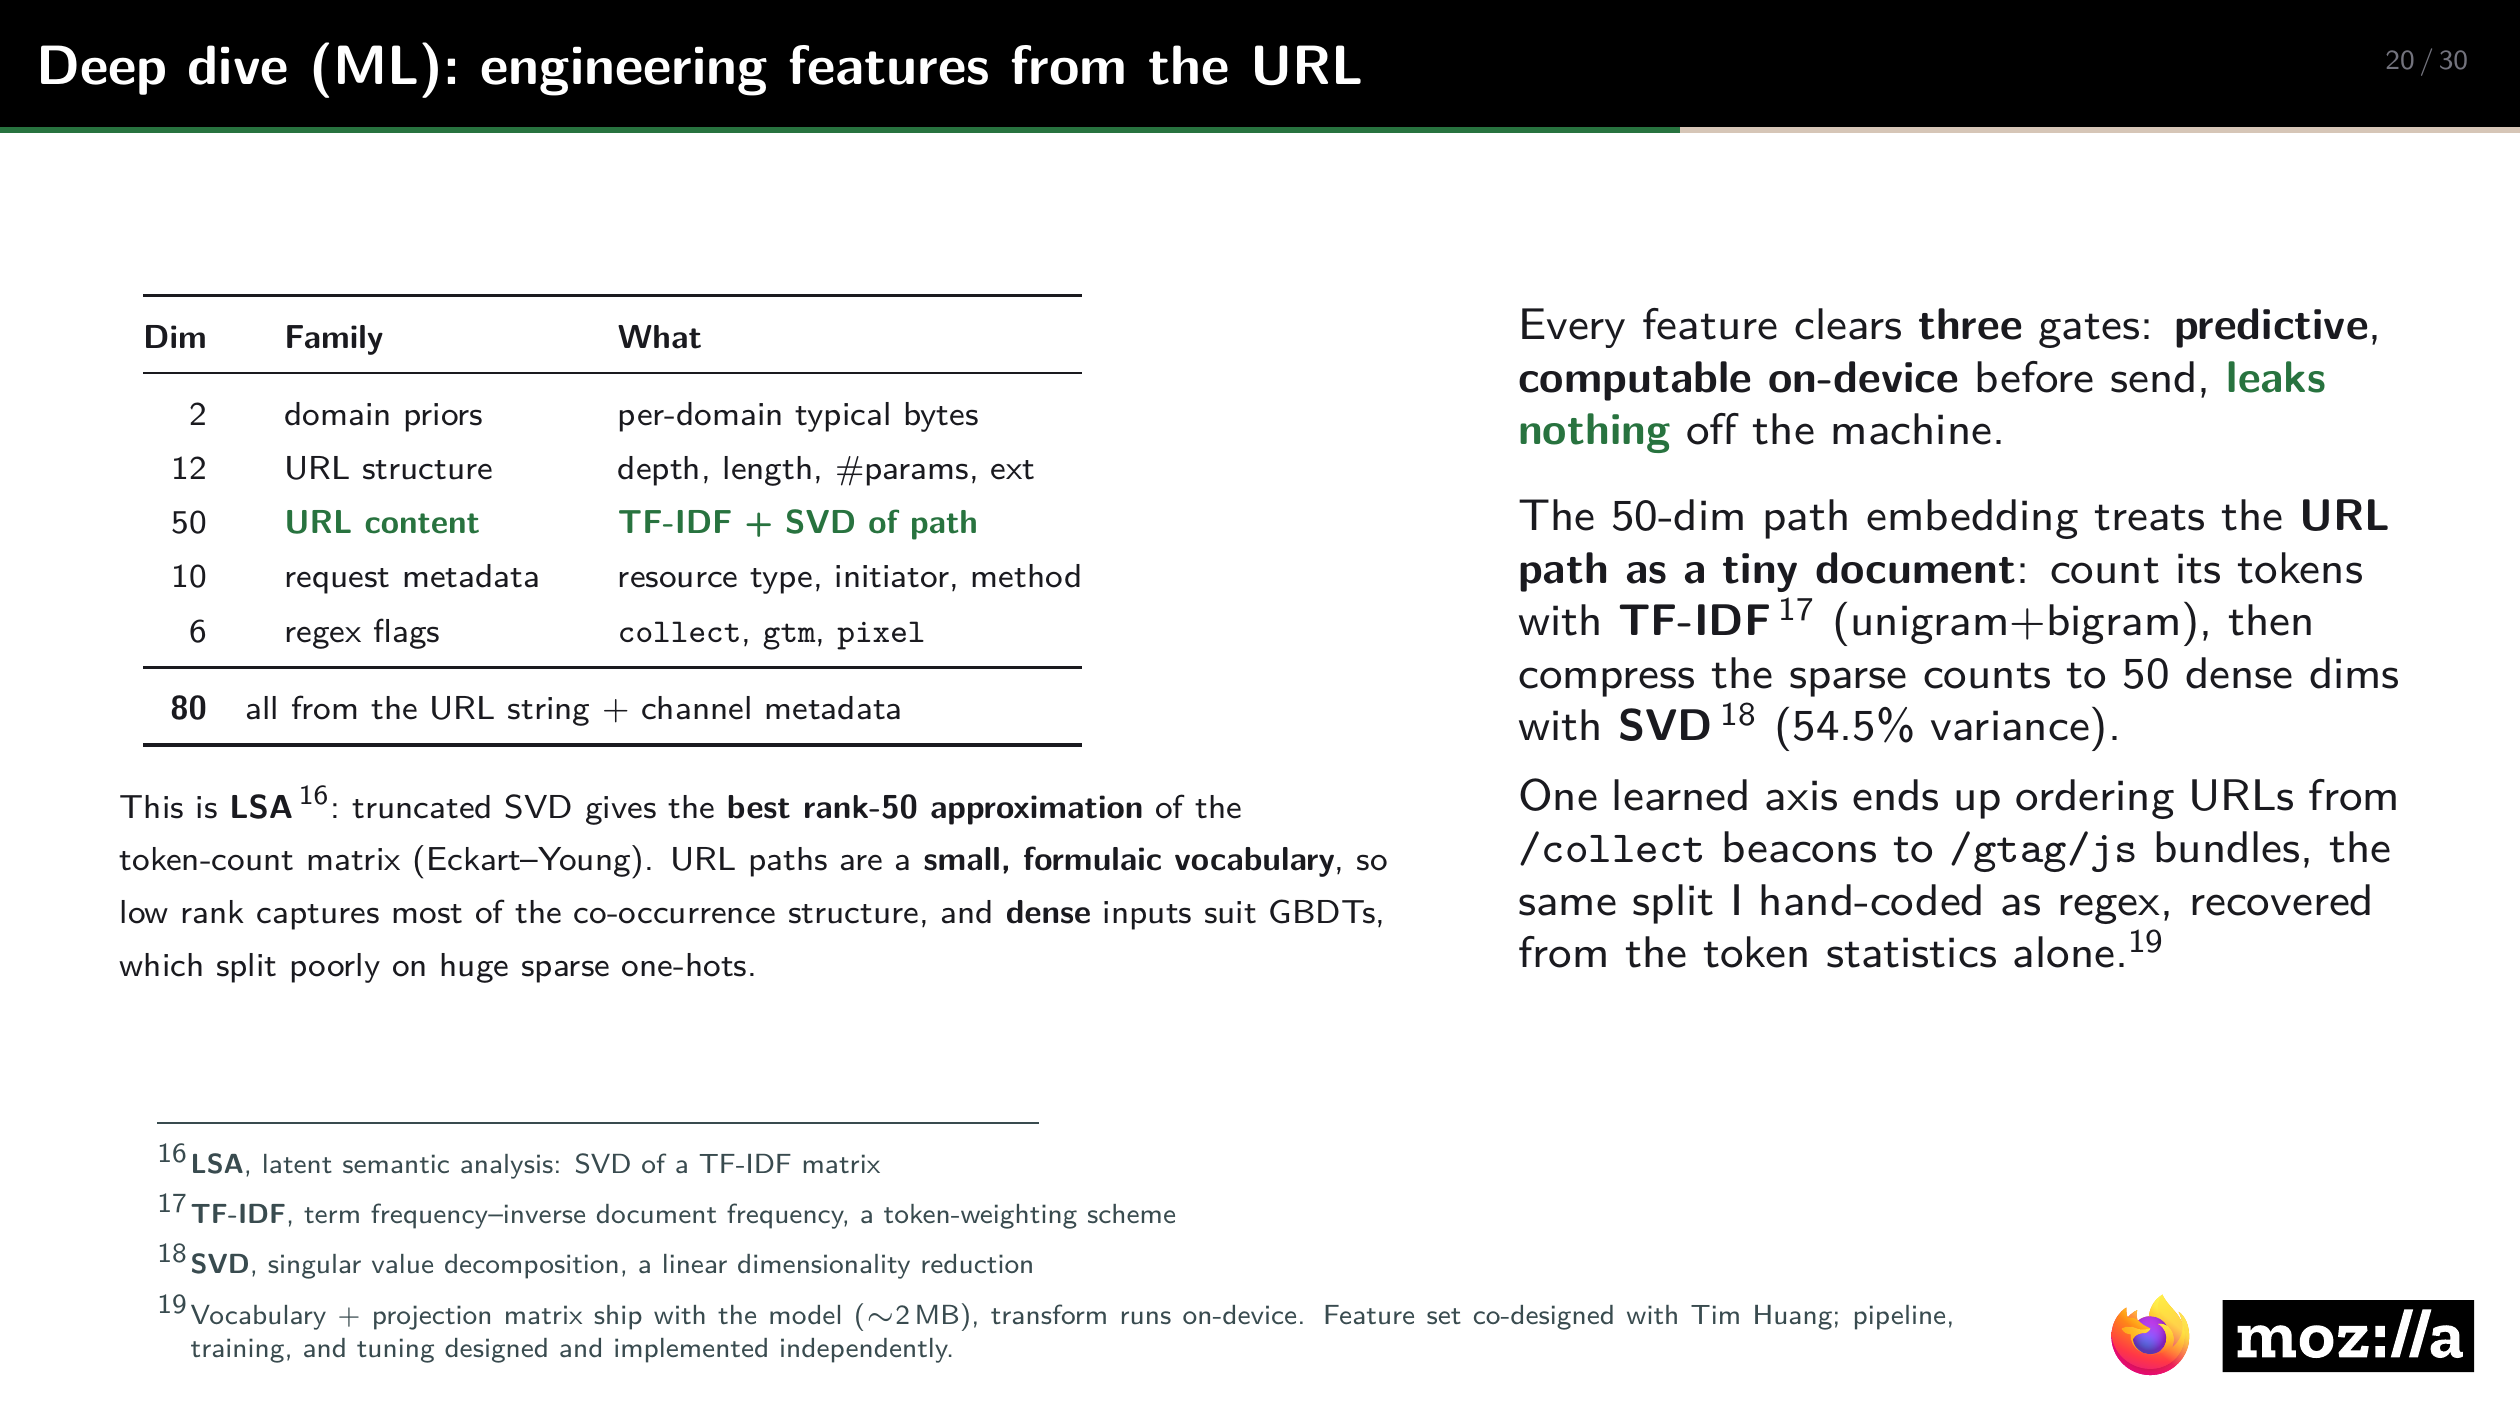
| Dims | Family | Contents |
|---|---|---|
| 2 | Domain priors | Median size for the domain, and for the domain and resource type |
| 12 | URL structure | Path depth, URL and query length, parameter count, file extension |
| 50 | URL content | Weighted path tokens, compressed (below) |
| 10 | Request metadata | Resource type, initiator, HTTP method, position in the page load |
| 6 | Pattern flags | Rules for beacon, script, pixel, cookie-sync, ad, and API paths |
The domain priors replace the domain name with its median training size, computed on folds excluding the request so that no label leaks into its own features (out-of-fold target encoding). They equal the predictions of the domain and domain-and-type tables, so the model starts from the baseline and uses the URL to correct it.
The central representation treats each path as a short document. Its unigram and bigram tokens are weighted by their frequency in the path, damped as , and by their rarity across paths (term frequency–inverse document frequency, TF-IDF). The vocabulary is capped at 50,000 terms, and a minimum document frequency of 5 removes session identifiers and cache-busting hashes. The sparse matrix is projected onto its 50 directions of greatest variation (truncated singular value decomposition, here latent semantic analysis), the best rank-50 approximation by the Eckart–Young theorem. Because URL paths use a small, formulaic vocabulary, 50 dimensions retain 54.5% of the variance. Dense dimensions also suit trees, which split on one feature at a time and gain little from tens of thousands of mostly zero columns.
The leading learned dimension orders URLs from collection beacons, such as /collect, to script bundles, such as /gtag/js, recovering from token statistics alone the distinction the hand-coded pattern rules were written to capture. In ablation, the rules alone are 23% worse than both feature sets combined, and the learned representation alone is 2% worse. It subsumes most of the rules and captures patterns they miss, such as Privacy Sandbox register-trigger paths.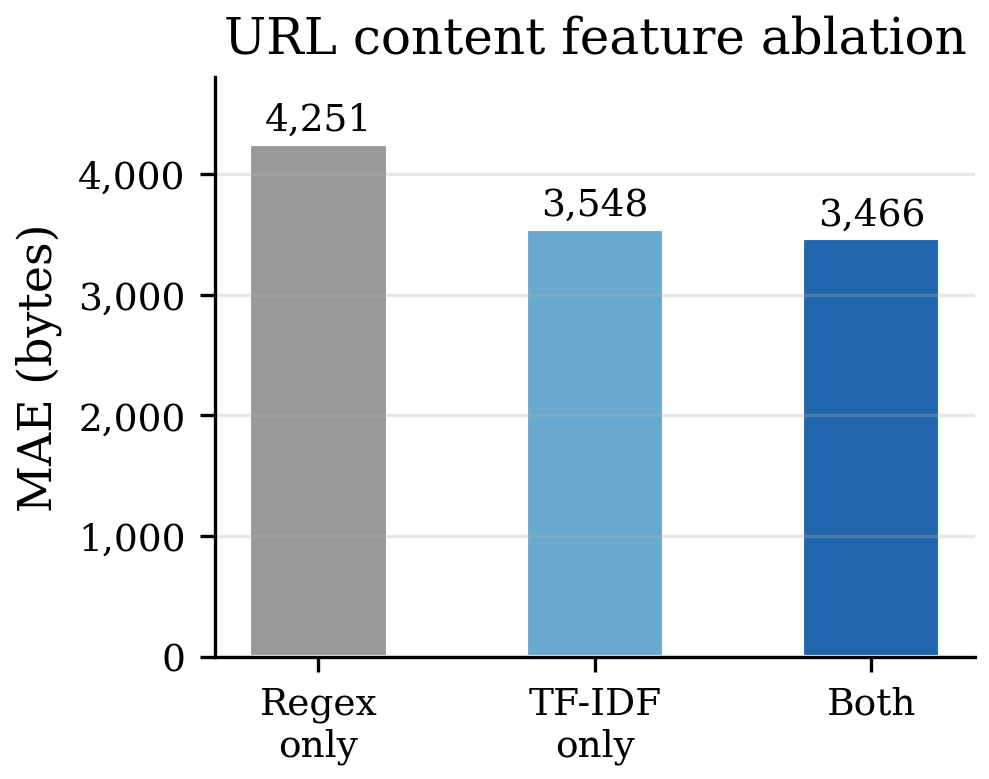 URL-content ablation from the same run as the loss ablation: the learned representation alone nearly matches both together.
Deployment
The ensemble is exported to ONNX, a portable model format, and evaluated inside Gecko, Firefox’s engine. With the TF-IDF vocabulary and projection, the artifact is about 2.5 MB, and the URL transform runs on the device. Inference runs after the block decision, so it adds no page-load latency and cannot change what is blocked. The model is designed to ship like the blocklist, signed and versioned outside browser releases, so retraining is a data update. A device that cannot afford inference can fall back to the domain-and-type table, which ships anyway as the model’s priors.
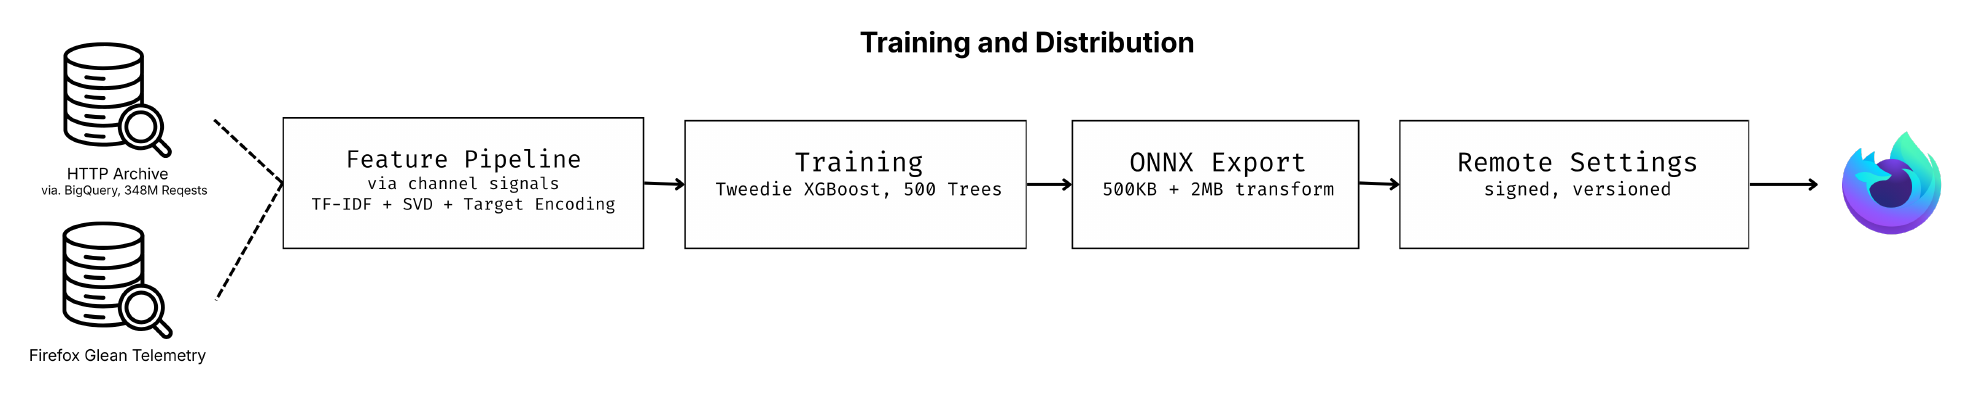
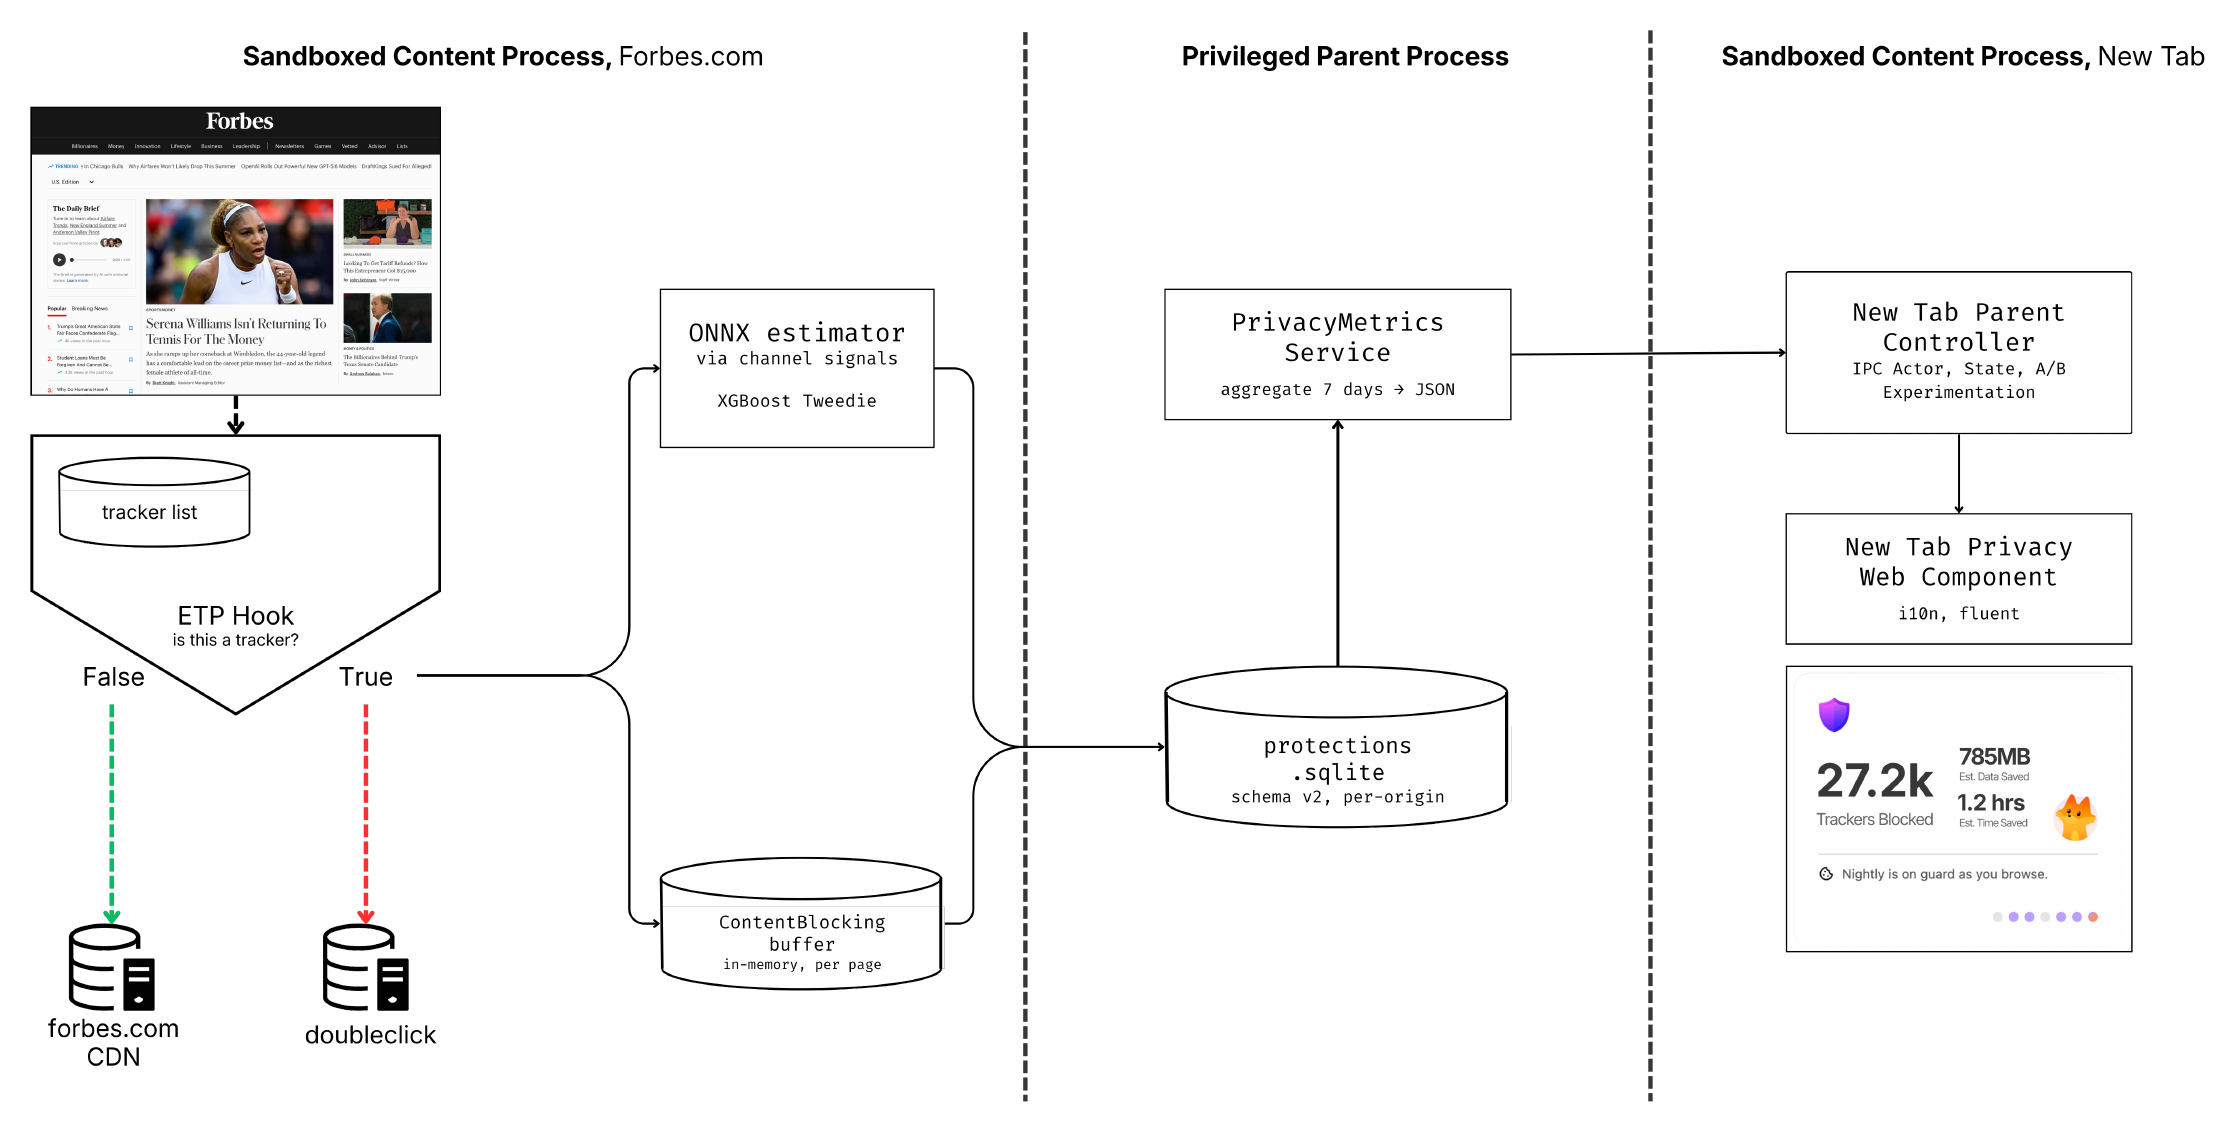
Blocking events are recorded in a local SQLite store, extended with per-category and per-origin data, and an aggregation service in the privileged parent process feeds the new-tab page over inter-process communication. The page receives only aggregates: no URL crosses into it, and nothing leaves the profile. The widget runs in Firefox Nightly.

Results
On held-out data, the model’s MAE is 4,246 bytes against the deployable table’s 6,802, a 37.6% reduction. It also outperforms the 188 MB full-path table and is 26% better than the best deployable table in the ladder, which adds the first path token to the key.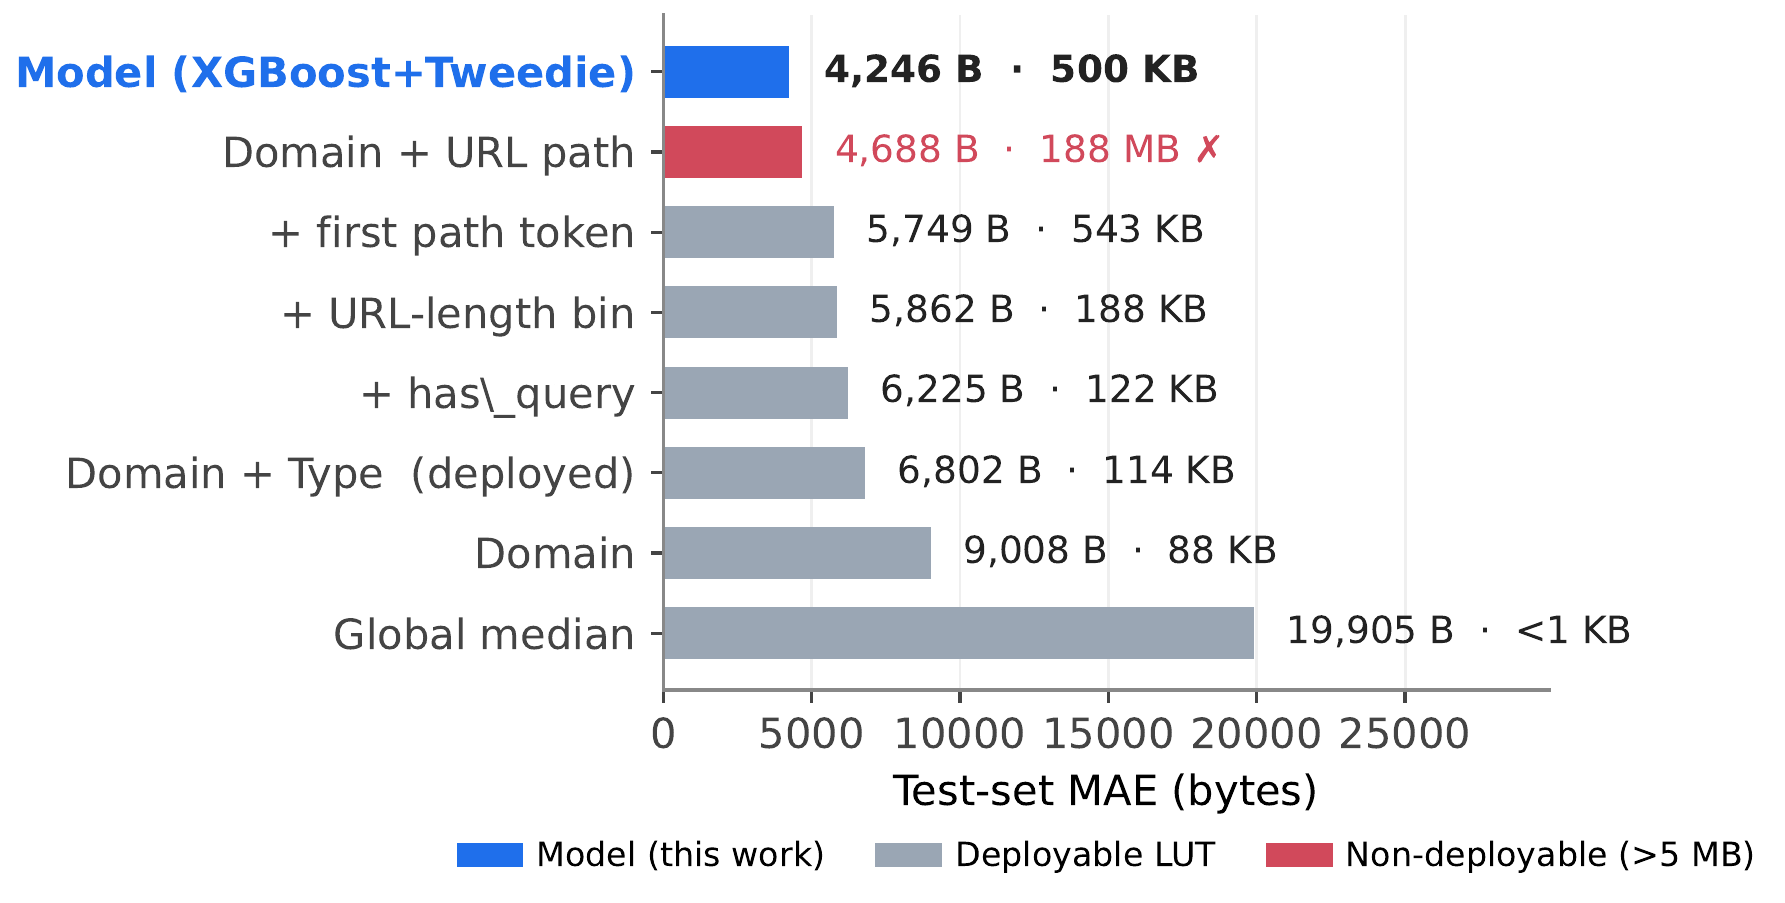 Every lookup table against the model, by test error and artifact size.
| Estimator | Size | MAE (bytes) |
|---|---|---|
| Global median | < 1 KB | 19,905 |
| Domain | 88 KB | 9,008 |
| Domain + resource type (baseline) | 114 KB | 6,802 |
| + has query string | 122 KB | 6,225 |
| + URL-length bin | 188 KB | 5,862 |
| + first path token | 543 KB | 5,749 |
| Domain + full path (not deployable) | 188 MB | 4,688 |
| Ridge regression | — | 9,651 |
| XGBoost, Tweedie | 500 KB | 4,246 |
The only table that approaches the model is too large to distribute, whereas the model surpasses it in an artifact small enough to ship.
Error by Segment
Splitting test requests by whether their path appeared in training separates generalization from memorization. Relative to the full-path table, the model is 7.0% better on seen paths (91.6% of requests) and 9.6% better on unseen ones, which carry about twenty times the error per request and therefore most of the total error despite being a twelfth of the traffic.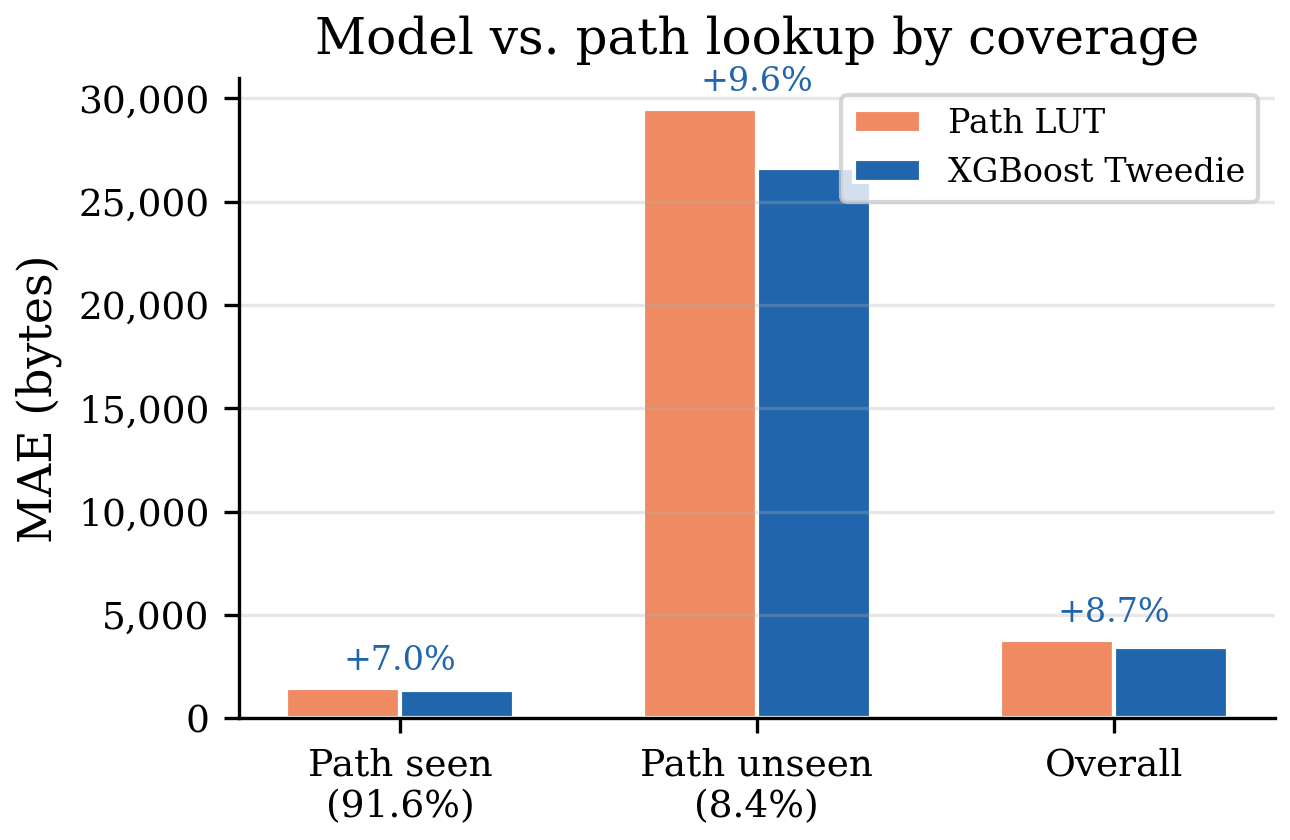 The model against the full-path table by path coverage, from a separate evaluation run.
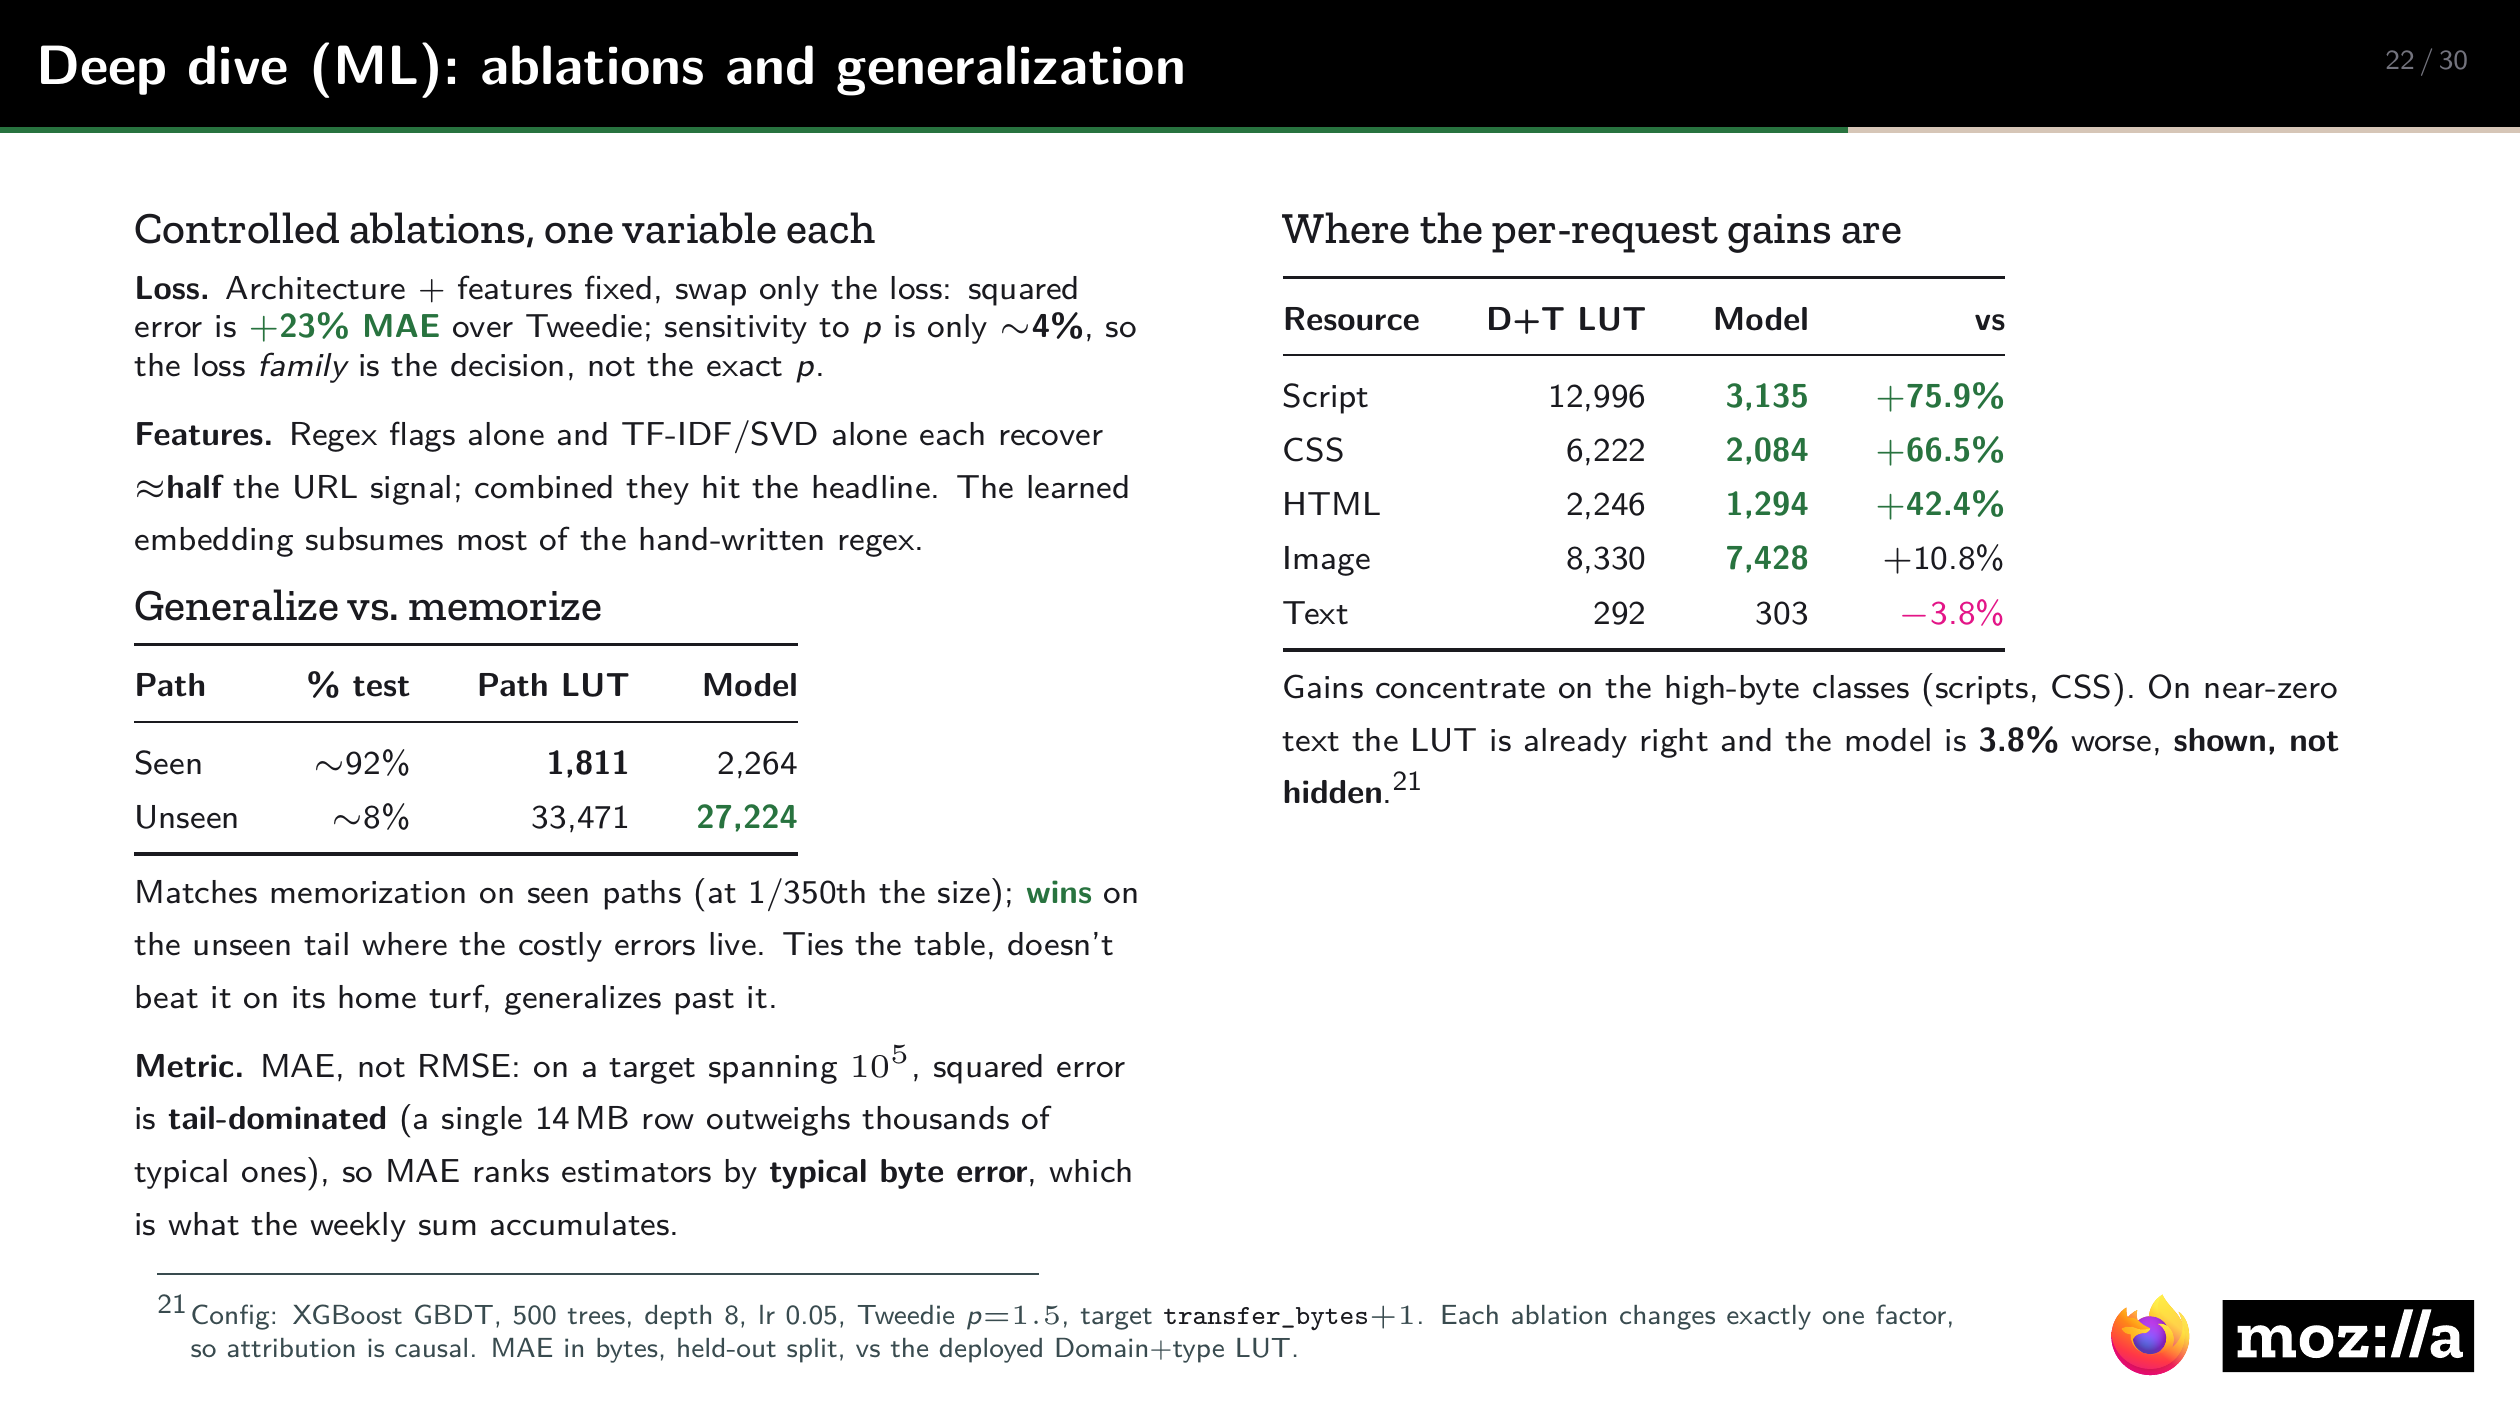
Gains also concentrate where the bytes are: relative to the domain-and-type table, error falls by 76% on scripts, 67% on CSS, 42% on HTML, and 11% on images. On nearly empty text responses the table is already accurate, and the model is 4% worse.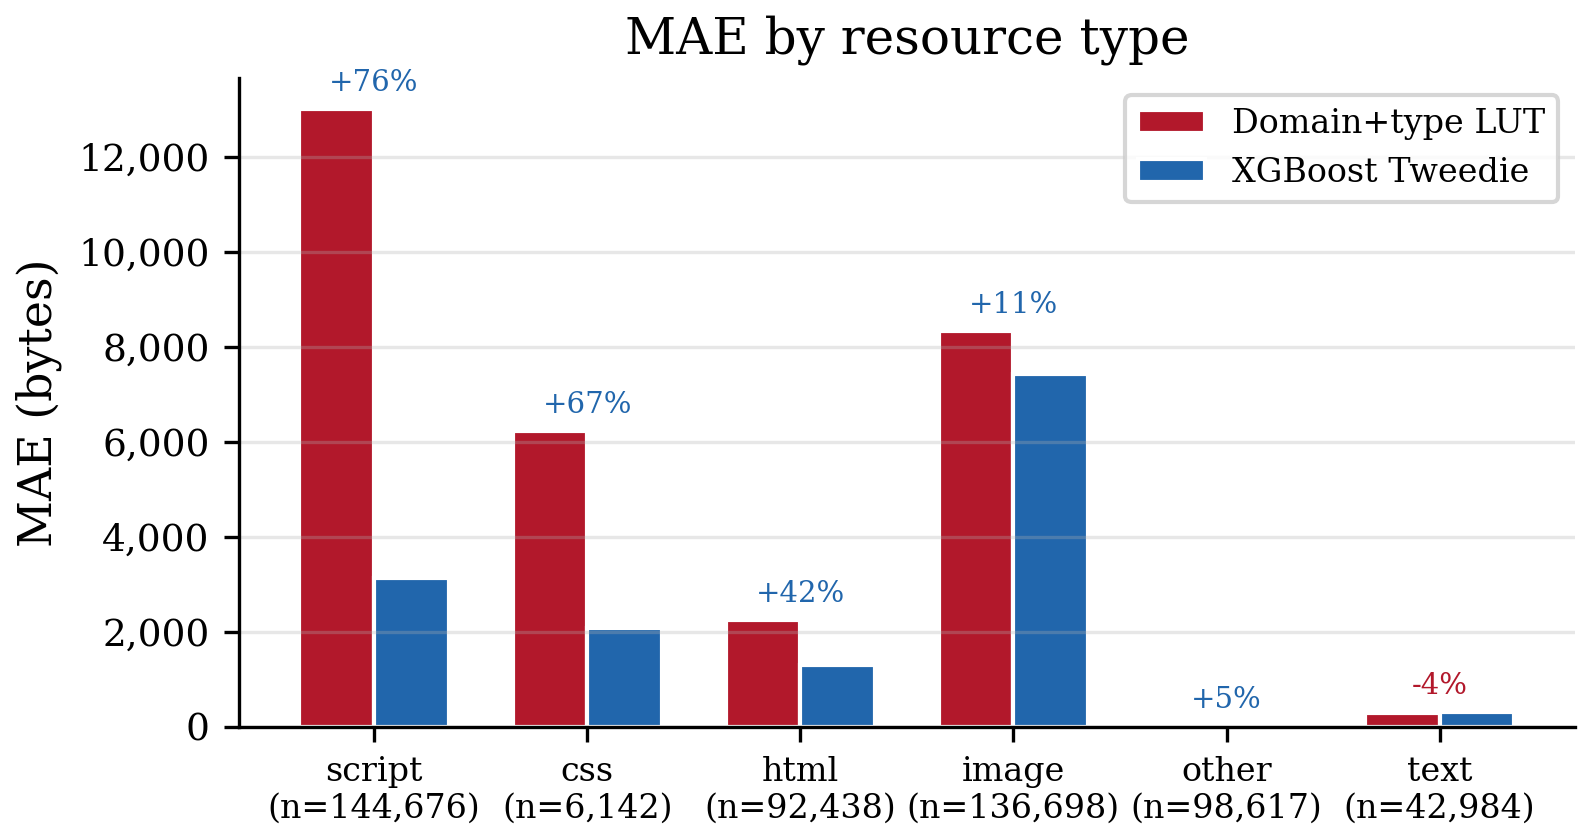 Error by resource type for the domain-and-type table and the model.
Aggregate Error
Users are shown a sum, so the objective matters a second time. MAE is minimized by the conditional median, whereas a total requires the conditional mean. The table stores medians, which lie below the mean on a right-skewed target, so its totals are biased low; Tweedie with a log link estimates the mean. If per-request errors are independent with mean and standard deviation , then over requests
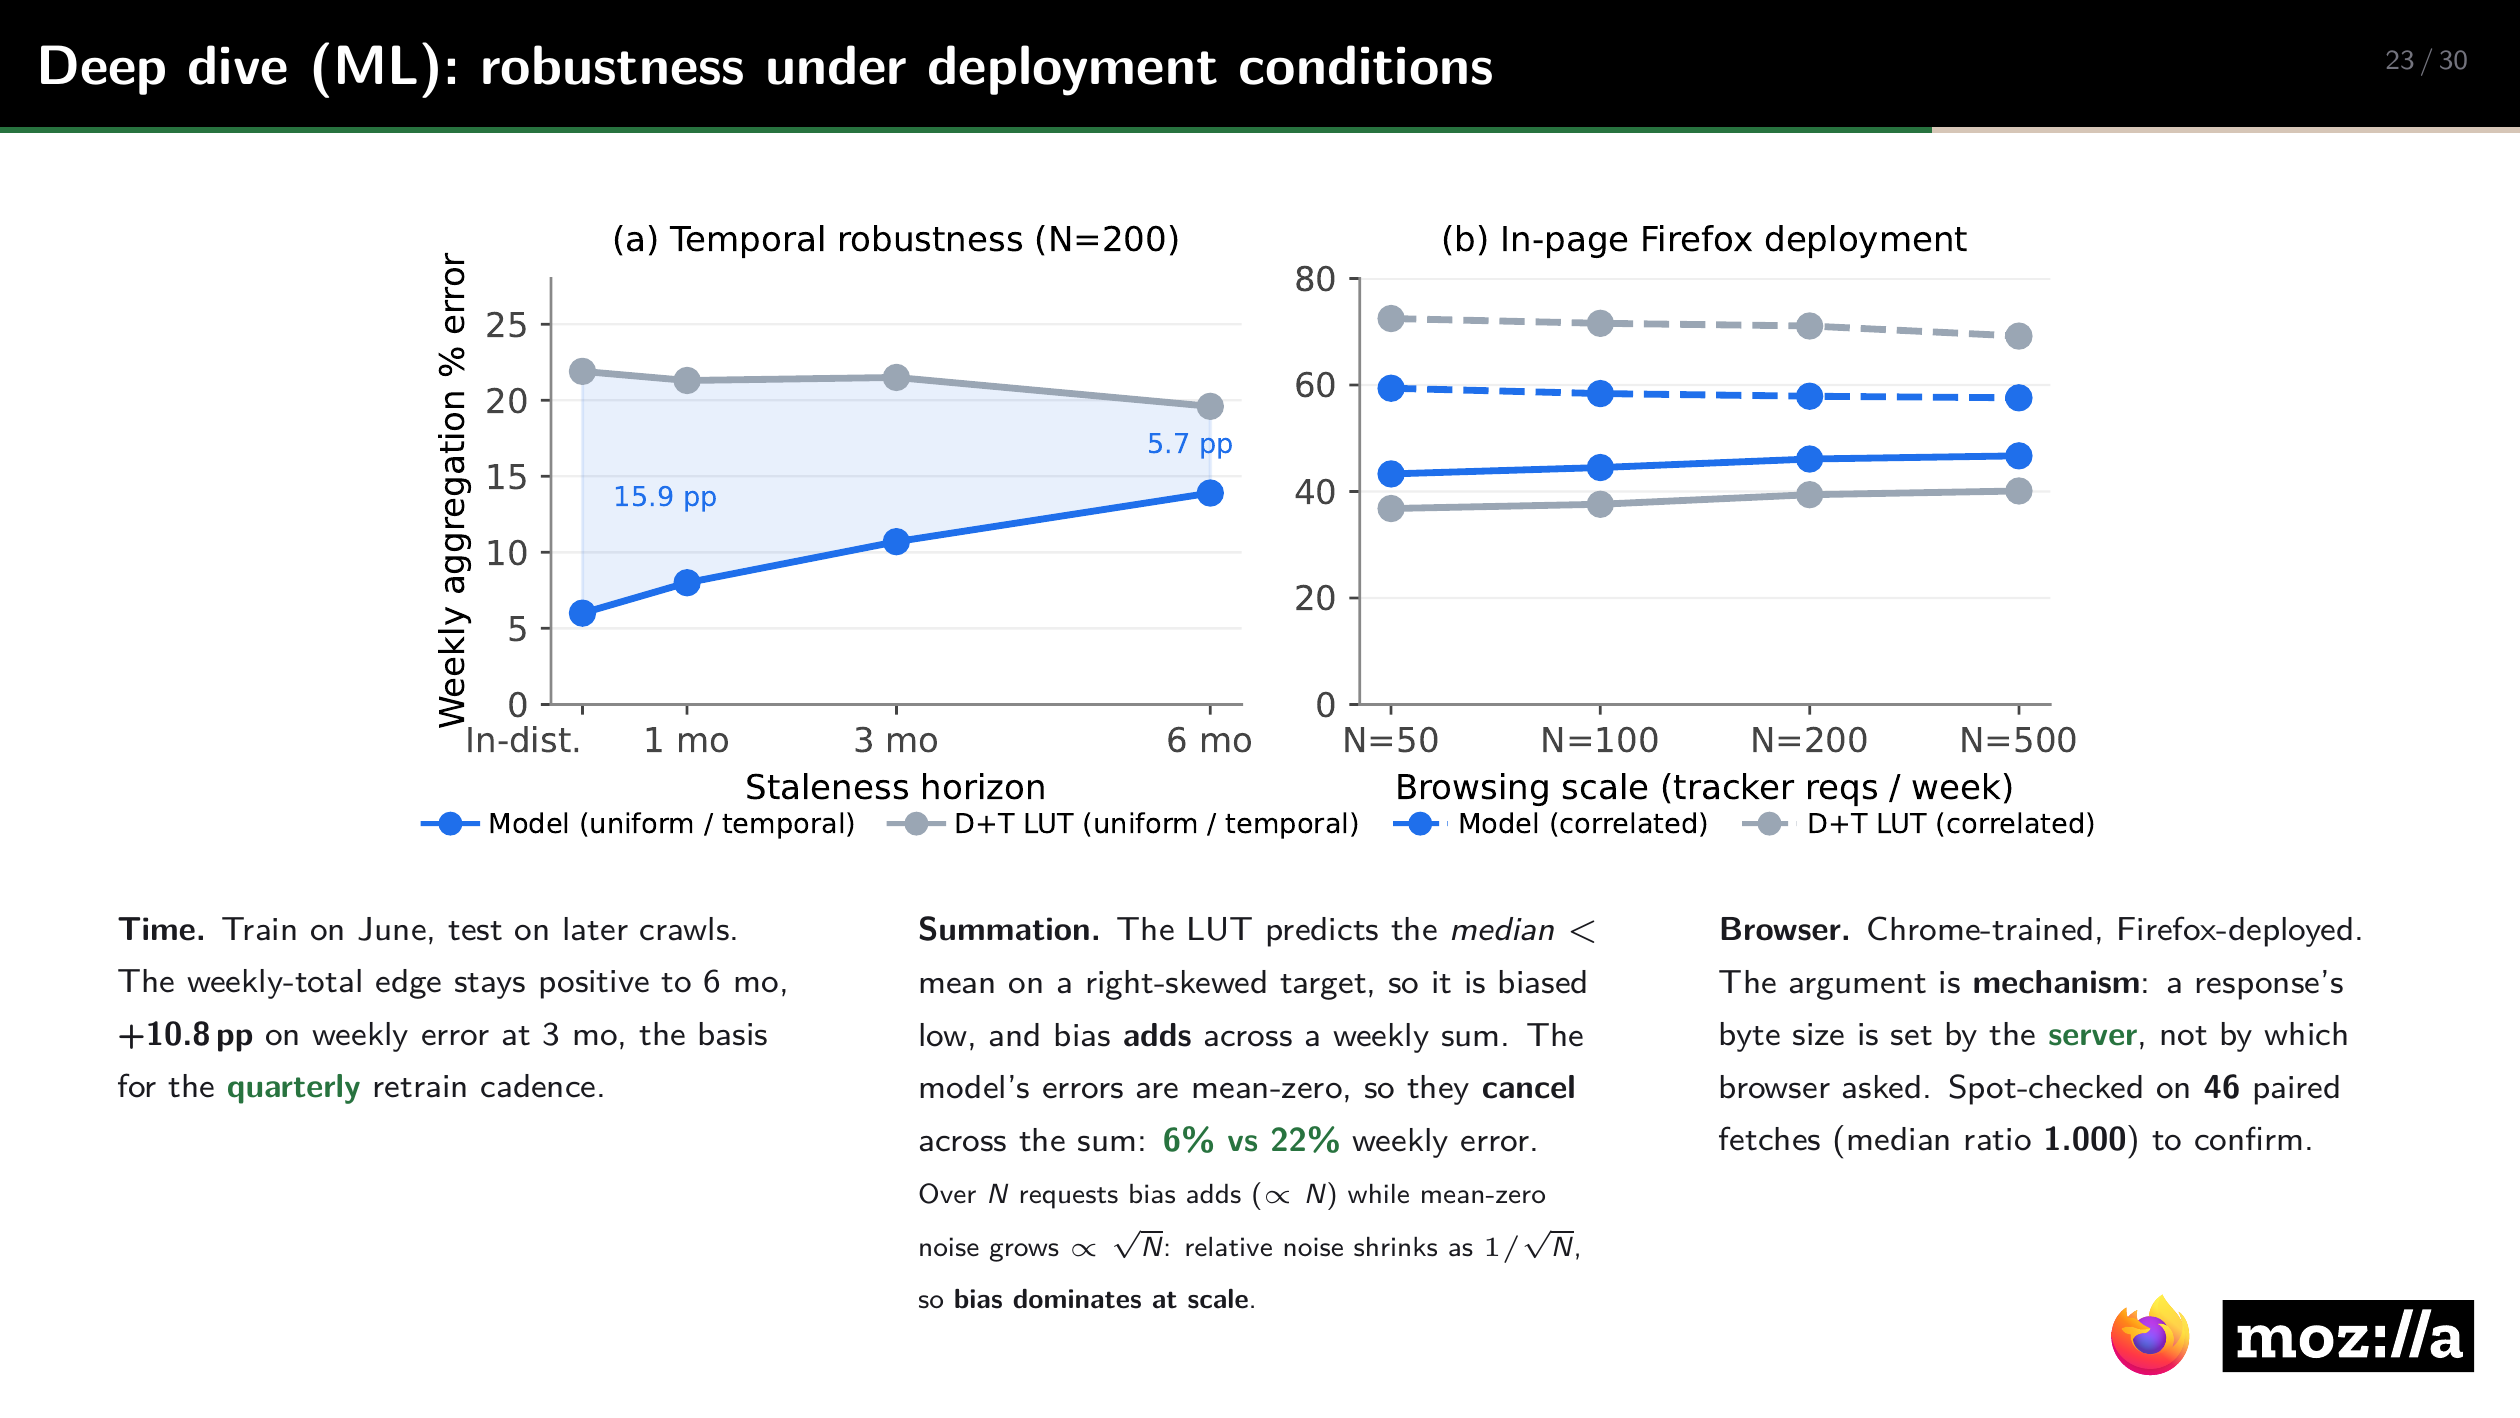
Relative to a total that grows as , the bias term stays constant while the noise term shrinks as , so at scale the error of a sum is its bias. In a simulated week of 200 blocked requests, the model’s total was off by a median of 6% and the table’s by 22%. When browsing concentrates on a few sites, as real browsing does, the table’s per-domain bias compounds and the gap widens to 12.9% against 36.4%.
Traffic generated by Firefox itself is the most direct test: 35 pages, 6,172 tracker requests, and 499 domains. Per request, the table was more accurate, 7,423 bytes against 8,367. On weekly totals the model was more accurate, 23.4% error against 31.3%, and 38.2% against 47.5% under concentrated browsing. Per-request accuracy and the accuracy of a sum are distinct objectives, and the product is judged on the second.
Temporal Drift
Trained on June and tested one, three, and six months later, the model leads per request at every horizon. Its error grows faster than the table’s, by about 40% over six months against under 10%, because it relies on URL detail that changes, mostly versioned script paths rather than new domains, but it starts far lower. On the weekly total, its error rises from 6% to 14% while the table’s stays near 20%, so the lead narrows from about 16 points to about 6. This curve sets the cadence: quarterly retraining keeps the model within three months of its data, where its weekly lead is still about 11 points.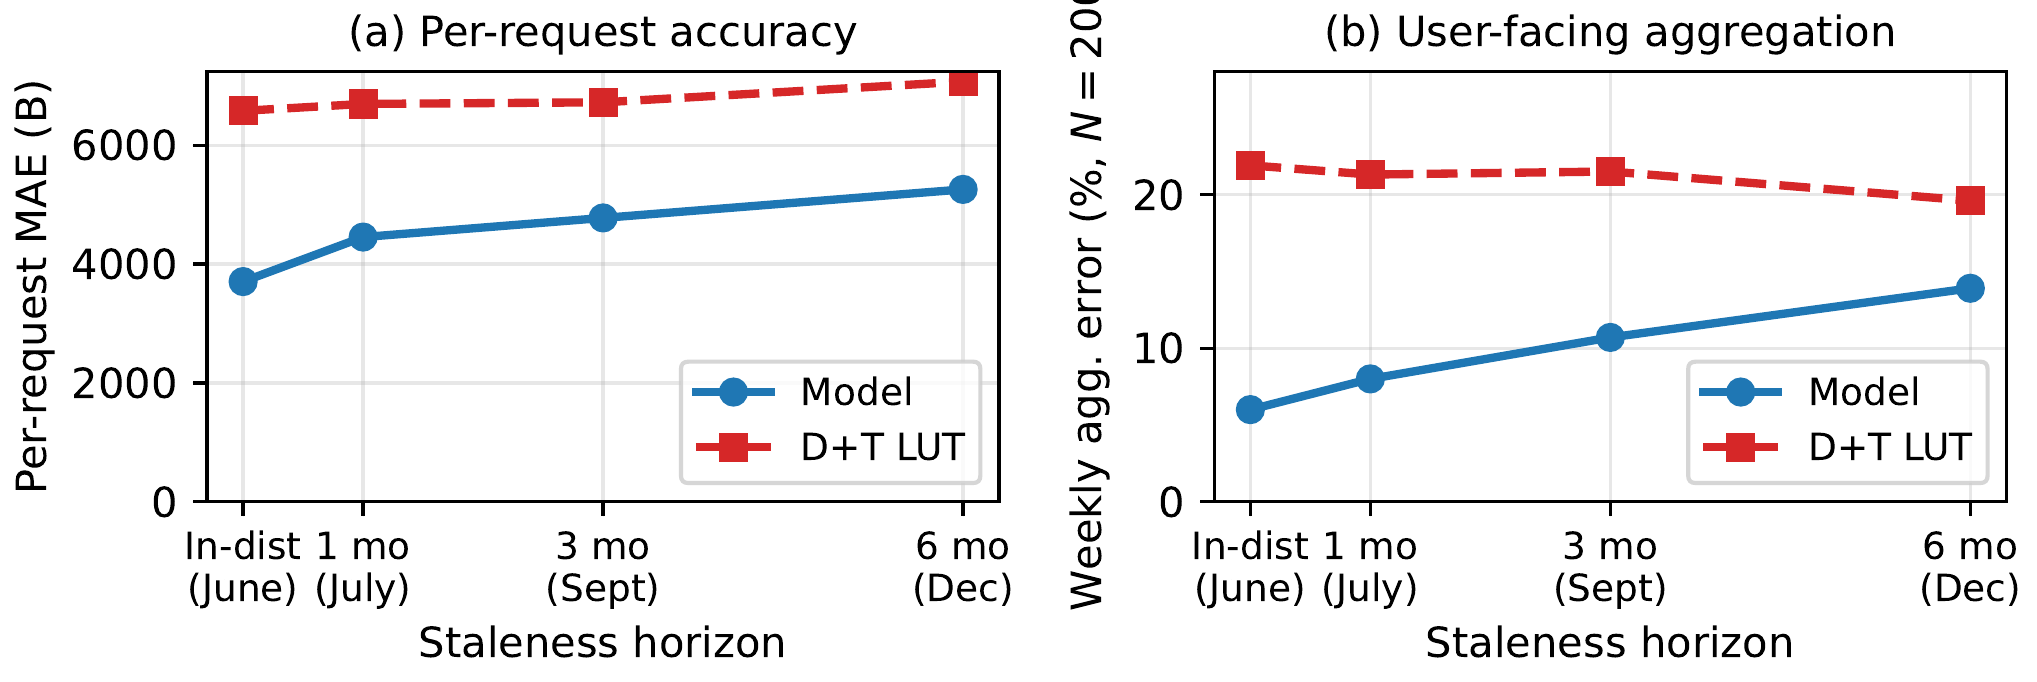 Trained on June and tested up to six months later, per request (left) and on a weekly total of 200 requests (right).
 Presentation slide: retraining cadence, pipeline, and signed distribution.