Problem Formulation and Target Design
Firefox knows which domains are trackers. It doesn’t know which ones are expensive, or how they’re expensive.
The Problem
Firefox’s Enhanced Tracking Protection blocks trackers using the Disconnect list1, which categorizes domains by privacy function: Advertising, Analytics, Social, Fingerprinting, Cryptomining. These categories tell you what a tracker does to your privacy, but they say nothing about what it costs your page load. A 1x1 tracking pixel and a 170KB ad SDK are both “Advertising.”
That distinction matters. The privacy metrics card on about:protections shows users how many trackers Firefox blocked, broken down by category. But “47 trackers blocked this week” is a flat number.2 It treats a tracking pixel from bat.bing.com (258 bytes) the same as a tag manager from googletagmanager.com (92-183KB of JavaScript, 305ms mean scripting time). If I could score each tracker by its likely performance cost, the card could show something much more specific: “Firefox saved you 890ms of CPU time and 1.2MB of bandwidth this week.”
The goal was to build a regression model that scores tracker domains by performance cost, enabling Firefox to surface specific, actionable information on the privacy dashboard.
-
The Disconnect tracking protection list is an open-source classification of tracker domains maintained by Disconnect. Mozilla’s Enhanced Tracking Protection consumes this list to categorize blocked domains. The list is available as
services.jsonand is updated regularly. ↩ -
Ghostery’s “Tracker Tax” study measured the top 500 websites and found pages loaded in ~8.6 seconds with trackers blocked vs. ~19.3 seconds with them present, with each additional tracker adding roughly 2.5% to page load time. For a more granular analysis, see Pourghassemi et al., “adPerf: Characterizing the Performance of Third-party Ads” (ACM SIGMETRICS, 2021), which used browser activity tracing to attribute specific CPU costs to individual ad scripts in Chromium. The HTTP Archive Web Almanac 2022 Third Parties chapter provides a broader census of third-party prevalence and blocking impact across millions of sites. ↩
The Progression: Classification to Single Score to Multi-Target
I went through three design iterations before landing on the final architecture.
First attempt: classification. Bucket trackers into Low / Medium / High cost tiers. This is the simplest approach, but where do you draw the boundaries? 45ms of blocking time and 55ms aren’t meaningfully different categories. The thresholds are arbitrary, and changing them means relabeling and retraining.
Second attempt: single regression score. One float in [0.0, 1.0] representing overall performance cost. This was better: continuous, no arbitrary buckets, flexible downstream thresholds. But it was lossy. Consider these two domains:
| Domain | CPU behavior | Network behavior | Composite score |
|---|---|---|---|
cdn.cookielaw.org | 79ms scripting | 84th percentile transfer | 0.81 |
connect.facebook.net | 270ms scripting | 83rd percentile transfer | 0.74 |
With a single score, these look similar. But they’re expensive in qualitatively different ways. The consent script loads in the critical path. The Facebook SDK loads async but burns CPU in the background. A single number collapses that distinction.
Final design: two-target regression. Two independent [0.0, 1.0] scores per domain. This preserves how something is costly:
- The UI can say “blocked a CPU-heavy tracker” vs “blocked a bandwidth-heavy tracker,” with different messages for different costs.
- Downstream consumers can weight dimensions differently. A mobile UI might emphasize network cost; a desktop UI might emphasize CPU.
- You can always derive a single aggregate later:
max(cpu, network)or a weighted sum. You can’t go the other direction.
The render_delay Post-Mortem
I actually designed three targets, not two. The original plan included render_delay to capture sync resources in <head> that block first paint. The hypothesis was that 5-10% of tracker domains would be render-blocking, and that this would be an independent axis worth modeling.
Then I queried the data. I pulled the render-blocking-insight audit from Lighthouse across the full 2024-06-01 HTTP Archive crawl. The top 20 render-blocking domains:
| Rank | Domain | Occurrences | What it is |
|---|---|---|---|
| 1 | fonts.googleapis.com | 3,497 | First-party font CDN |
| 2 | static.flashscore.com | 2,330 | First-party static assets |
| 3 | cdnjs.cloudflare.com | 1,206 | Public CDN |
| 4 | cdn.jsdelivr.net | 737 | Public CDN |
| … | … | … | First-party CSS and CDNs |
| 17 | cdn.cookielaw.org | 321 | Consent manager |
All first-party CSS and CDN resources. The only tracker in the top 20 was cdn.cookielaw.org, a consent manager. Not ad scripts. Not analytics. Not social widgets. A consent banner.
This killed the target, but the reason it died is the interesting part. Trackers almost never block rendering because ad networks and analytics vendors learned long ago that blocking rendering kills their own metrics.3 If your ad script delays first paint, the user might bounce before the ad loads, which means zero viewability and zero revenue. The incentive structure guarantees that tracker scripts load asynchronously.
Render-blocking is a property of how sites include resources, not of the resources themselves. A site could make Google Tag Manager render-blocking by putting it in a sync <script> tag in <head>, but almost nobody does because it would destroy their Core Web Vitals.4 The render-blocking audit catches the rare exceptions, not a systematic pattern.
Decision: Dropped render_delay. Two targets capture the meaningful variation in tracker performance cost.
-
Google’s own Publisher Tag best practices explicitly recommend async loading, and the Google Publisher Tag only supports asynchronous rendering. The IAB’s LEAN Principles (Light, Encrypted, AdChoices-supported, Non-invasive) similarly call for lightweight, non-blocking ad delivery. The economic logic is straightforward: render-blocking ads delay first paint, increasing bounce rates before the ad even loads, which tanks viewability metrics that determine ad revenue. ↩
-
Google’s Core Web Vitals (LCP, INP, CLS) became Search ranking signals in 2021, giving publishers a direct SEO incentive to minimize render-blocking third-party scripts. The thresholds and methodology are documented in Sullivan, McQuade, and Walton, “Defining the Core Web Vitals metrics thresholds” (web.dev, 2020). ↩
The Two Targets
| Target | What it captures | Data source | User-facing meaning |
|---|---|---|---|
main_thread_cost | CPU time: scripting, parse/compile | Lighthouse bootup-time audit | ”used your CPU in the background” |
network_cost | Bandwidth and transfer overhead | HTTP Archive request data | ”used your bandwidth” |
main_thread_cost is built from Lighthouse’s bootup-time audit5, which breaks down per-script CPU time into scripting execution and parse/compile overhead. It captures the cost that directly impacts Total Blocking Time and Interaction to Next Paint, the main thread work that makes pages feel sluggish. The score is a weighted percentile rank:
main_thread_cost = 0.50 * prank(total_cpu_ms)
                 + 0.35 * prank(scripting_ms)
                 + 0.15 * prank(parse_compile_ms)
network_cost is built from HTTP Archive request-level data: median transfer size, total bytes per page from the domain, and request count. It captures the bandwidth competition with first-party resources. The score:
network_cost = 0.50 * prank(p50_transfer_bytes)
             + 0.30 * prank(bytes_per_page)
             + 0.20 * prank(requests_per_page)
These weights are design decisions, not learned parameters. I validated them by checking that known domains produced score profiles matching expert intuition. I haven’t done a formal sensitivity analysis on the weights, so take them as reasonable defaults rather than optimal values.
-
Lighthouse’s bootup-time audit measures per-script CPU time broken into scripting execution, parse/compile, and other categories. It only reports scripts exceeding a minimum CPU threshold, which is why 52% of tracker domains in our dataset have no CPU data; they didn’t cross the reporting floor. ↩
Target Independence
This is the key evidence that two targets was the right call. If CPU and network cost were correlated, one score would suffice. They aren’t.
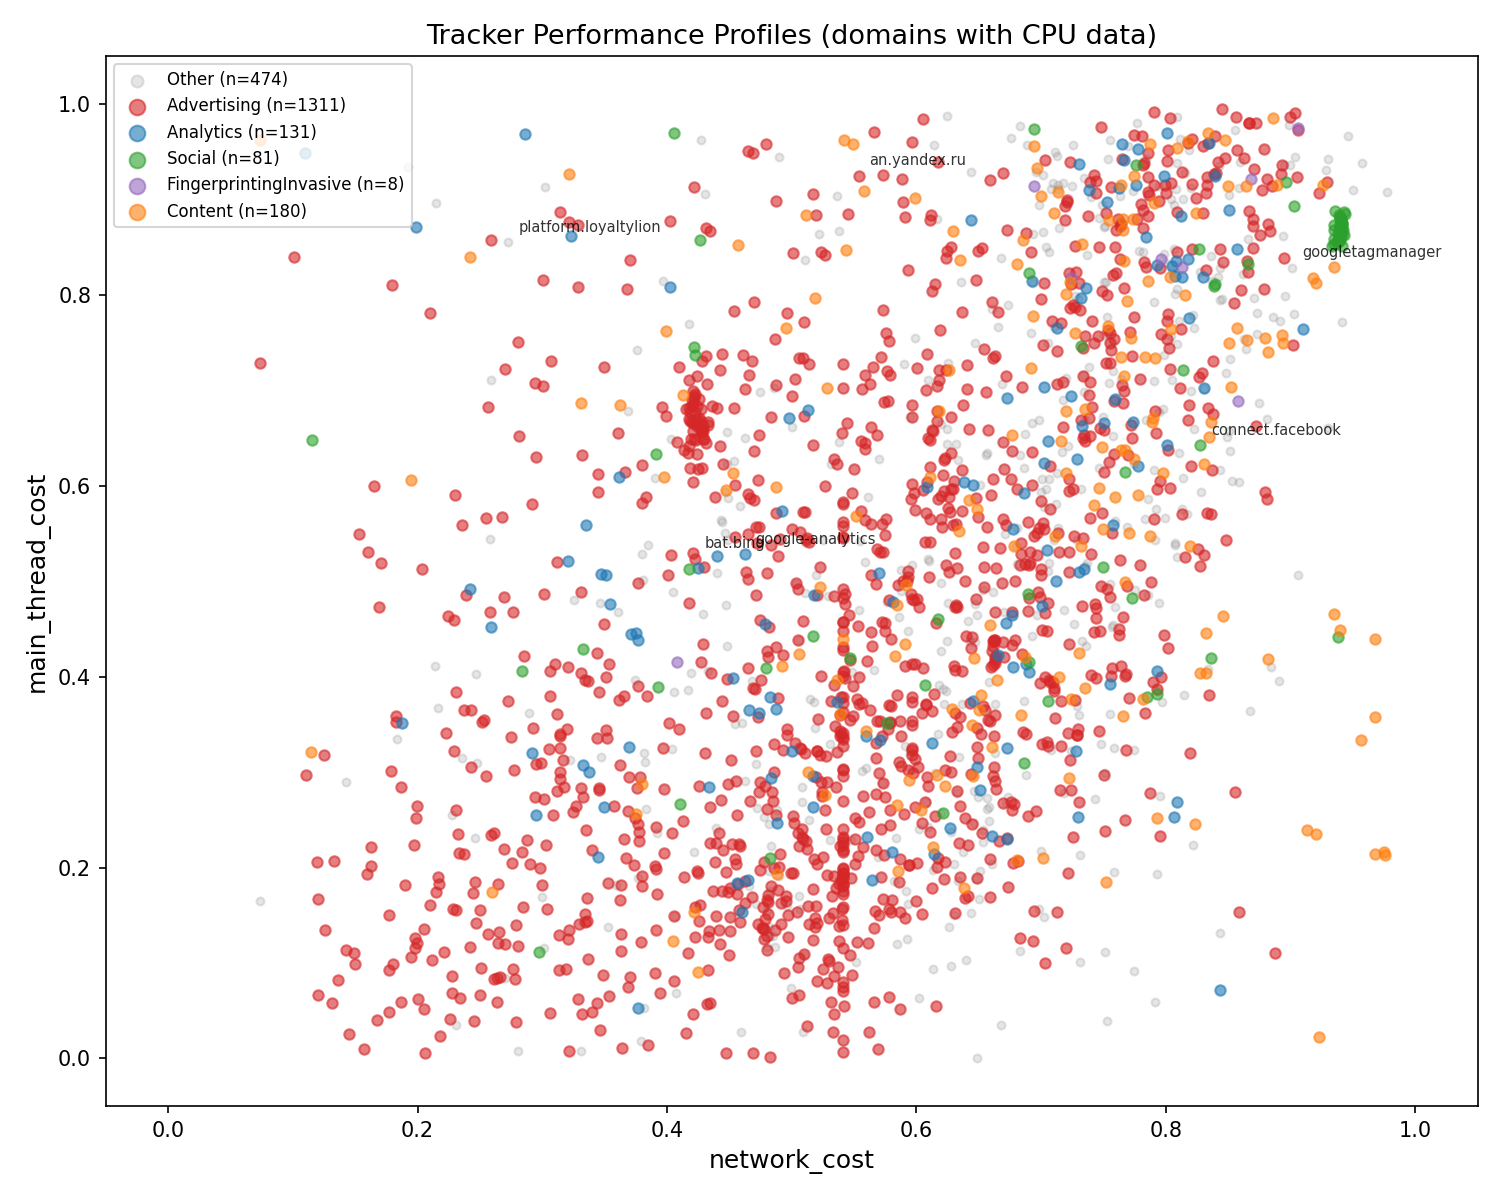
Every dot is a tracker domain with real Lighthouse data, colored by Disconnect category. The scatter is dispersed, not diagonal.
- Top-left (high CPU, low network):
platform.loyaltylion.com, which burns 1,241ms CPU from a 2-byte request. The “invisible CPU” archetype. - Top-right (high CPU, high network):
googletagmanager.com, heavy on both axes. Worst-case tracker. - Bottom-right (low CPU, high network): CDN-served ad creatives. Big files but not much execution.
- Bottom-left (low CPU, low network): lightweight beacons and pixels.
Advertising domains (red) span the entire space. There is no single “ad tracker” performance profile. Some ads are pixels, some are heavyweight SDKs. This is exactly why Disconnect category alone can’t predict performance cost, and why it barely registers in SHAP feature importance analysis.
Why Regression, Not Classification
Even with two axes, the question of continuous scores vs discrete buckets comes up. The case for regression:
- No arbitrary boundaries. Where do you draw the line between “moderate” and “heavy” CPU cost? 45ms and 55ms aren’t meaningfully different categories.
- Flexible downstream use. The privacy metrics card can threshold at 0.5 for “high impact” today and 0.7 tomorrow without retraining. Each axis can use different thresholds.
- Richer signal. A main_thread_cost of 0.92 vs 0.71 tells you something. “High” vs “high” doesn’t.
Why Per-Domain Scoring
The same tracker domain (e.g., www.google-analytics.com) can serve both a heavyweight analytics script and a lightweight pixel endpoint. I had to decide what granularity to score at.
I chose domain level for three reasons:
- Firefox’s storage is domain-granular.
TrackingDBServicerecords blocked trackers by domain. The privacy metrics card displays per-domain counts. Domain-level scores slot directly into the existing data flow. - At block time, Firefox knows the domain but hasn’t fetched the resource. Per-request features (transfer size, content type) aren’t available because the request was blocked. Domain-level features can be precomputed and shipped as a lookup table.
- Worst-case scoring is the right framing. Each dimension reflects the upper bound of that cost type the user is protected from. A domain that serves heavyweight scripts on 5% of pages gets a high CPU score based on its worst-case behavior. This is the right signal for “Firefox prevented X.”